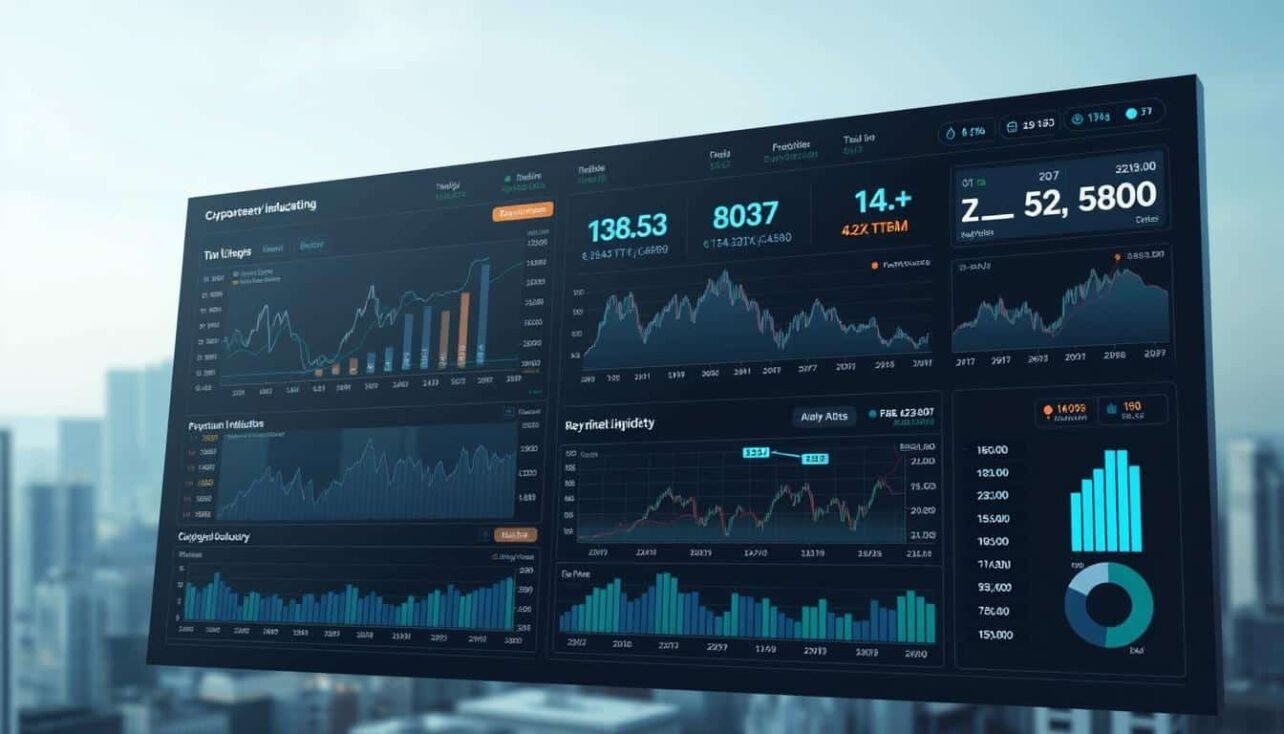
In fast-paced digital markets, tracking transaction levels offers critical insights into participant behavior and price trends. This metric reflects the total activity across exchanges during a set period, acting as a pulse check for market health. When values surge, it often signals strong investor interest, while declines may hint at uncertainty or reduced opportunities.
Liquidity metrics reveal how easily assets can be bought or sold without drastic price shifts. These tools are vital for managing risk, especially in decentralized environments where traditional financial rules don’t always apply. By studying patterns, traders gauge whether movements have genuine momentum or lack broader support.
Combining real-time data with historical comparisons creates a robust framework for decision-making. For example, spikes in activity often align with major news events or technical breakthroughs. Platforms like OSL Academy provide detailed guides to interpret these signals effectively.
Seasoned professionals use this approach to spot emerging trends and potential reversals. Whether executing short-term strategies or planning long-term investments, understanding these dynamics separates informed decisions from guesswork.
Key Takeaways
- Transaction levels reflect market sentiment and participation intensity
- Liquidity metrics determine how smoothly positions can be opened or closed
- Historical comparisons highlight anomalies and trend reliability
- Combining tools improves accuracy in volatile environments
- Real-time monitoring adapts strategies to shifting conditions
Understanding Cryptocurrency Trading Volume
The heartbeat of digital finance lies in how assets move between participants. Tracking these flows helps decode sentiment shifts and potential opportunities. This section breaks down core concepts behind exchange activity metrics.

What Does Exchange Activity Measure?
Trading volume counts all completed transactions for a digital asset within a set timeframe. A 24-hour window remains the most common benchmark. Higher numbers suggest active participation, while dips may reveal hesitation or consolidation phases.
Unlike stock exchanges with fixed hours, digital platforms never close. This creates unique challenges. Activity flows across time zones require tools that filter noise from meaningful patterns.
| Timeframe | Significance | Common Triggers |
|---|---|---|
| Daily | Short-term sentiment | News releases, technical events |
| Weekly | Momentum shifts | Regulatory updates, platform changes |
| Monthly | Long-term trends | Protocol upgrades, adoption milestones |
Patterns Through Time
Historical comparisons reveal how assets react under stress or hype. For example, Bitcoin’s 2021 surge saw record activity levels before its price peak. Such correlations help separate fleeting spikes from sustainable trends.
Seasoned observers watch for mismatches between price and participation. A rally with flat transaction counts often lacks staying power. Conversely, rising activity during dips might signal accumulation phases.
The Importance of Liquidity in Crypto Markets
The backbone of efficient digital asset exchanges lies in their ability to balance supply and demand seamlessly. When assets flow freely, participants experience fewer disruptions in executing strategies. This equilibrium directly affects how prices respond to orders and market news.

Liquidity and Its Impact on Price Execution
Slippage – the gap between expected and actual order prices – shrinks in active markets. Platforms with deep order books allow users to open or close positions without drastically moving the needle. For example, major exchanges often process large transactions efficiently due to their high liquidity pools.
Thinly traded assets face opposite challenges. Sudden price swings become common when few participants exist to absorb orders. This volatility complicates exit strategies during downturns and increases risks for holders.
Three critical advantages emerge in liquid environments:
- Tighter spreads between buying and selling prices
- Accurate valuations reflecting real-time sentiment
- Lower costs for entering or exiting positions
Monitoring these factors helps traders avoid platforms prone to manipulation. As market trends evolve, understanding depth charts becomes as vital as tracking price movements. Those who master this balance gain clearer signals for timing their moves.
Key Metrics: Volume and Price Dynamics
Market dynamics often hinge on two critical factors: participation intensity and valuation shifts. Observing how these elements interact reveals whether shifts represent temporary noise or meaningful momentum. This relationship serves as a compass for navigating volatile conditions.

Interpreting Volume Spikes
Sudden surges in activity act like flashing warning lights. These spikes often precede major valuation shifts, signaling urgency among large participants. For example, regulatory announcements or protocol upgrades frequently trigger such patterns.
Three scenarios demand attention:
- Spikes during upward trends suggest strong conviction
- Activity surges during declines may indicate panic selling
- Isolated spikes without follow-through often trap impulsive traders
Analyzing Price Movements
Valuation changes gain credibility when supported by rising participation. A rally with steady growth in transactions typically has staying power. Conversely, advances with shrinking activity often reverse quickly.
Divergences between these metrics reveal hidden opportunities. When values climb but participation drops, it hints at weakening demand. Historical data shows that price levels with heavy past activity tend to reactivate when revisited, creating predictable decision points.
Tools and Techniques for Volume Analysis
Modern digital asset evaluation relies heavily on specialized methods that decode participation patterns. These approaches transform raw numbers into actionable insights, revealing where buyers and sellers cluster. By combining multiple perspectives, traders build clearer pictures of momentum shifts.

Volume Profiles and Their Benefits
Activity distribution charts map where transactions accumulate across price levels. Areas with heavy concentration often act as magnets during pullbacks or breakouts. For instance, zones with months of accumulated activity tend to influence future decisions more than temporary spikes.
This technique helps identify hidden support or resistance areas. When prices revisit these zones, participants frequently react based on historical behavior patterns. Platforms offering these features allow users to spot high-confidence entry points missed by basic charts.
Volume-Weighted Indicators Explained
Sophisticated metrics blend transaction intensity with valuation changes. The Volume-Weighted Average Price (VWAP) shows average prices adjusted for participation levels, filtering out noise from low-activity periods. Traders use it to assess whether moves have broad support.
Other tools like cumulative flow track buying/selling pressure over time. When paired with historical benchmarks, they highlight deviations signaling potential reversals. Real-time dashboards update these metrics, letting users adapt strategies as conditions shift.
Step-by-Step Guide to Analyzing Crypto Trading Volume
Successful evaluation of digital asset movements begins with structured examination of participation metrics. This systematic approach transforms raw numbers into actionable intelligence, helping traders distinguish meaningful shifts from temporary fluctuations.
Establishing Historical Context
Start by calculating average transaction levels across weekly and monthly periods. These baselines reveal typical activity patterns for each asset. Platforms like CoinGecko provide archived data showing how events like exchange listings or protocol updates influenced past behavior.
| Timeframe | Primary Use | Common Tools |
|---|---|---|
| 7-Day | Spot short-term deviations | Moving averages |
| 30-Day | Identify cyclical patterns | Seasonality charts |
| 90-Day | Assess trend sustainability | Cumulative flow metrics |
Leveraging Live Monitoring Systems
Modern platforms offer dashboards tracking second-by-second changes. Set alerts for when activity exceeds 150% of historical averages – these thresholds often precede volatility. Cross-check spikes against news feeds and social sentiment trackers to confirm their origins.
Always verify unusual patterns across three exchanges minimum. Discrepancies between platforms may reveal artificial pumps or reporting errors. Consistent surges across multiple sources typically carry more weight in decision-making processes.
Indicators for Market Liquidity: OBV, MFI, and Chaikin A/D Oscillator
Sophisticated tools empower participants to navigate shifting conditions with precision. Three specialized metrics offer unique insights into buying pressure, overbought zones, and momentum shifts. These instruments help decode hidden patterns that basic charts often miss.
On Balance Volume (OBV)
OBV tracks cumulative buying and selling pressure by adding transaction counts on up days and subtracting on down days. When the line trends upward, it signals accumulation despite price fluctuations. Divergences between OBV and asset values often foreshadow reversals weeks in advance.
Money Flow Index (MFI)
This tool combines price changes with transaction intensity to spot exhaustion points. Readings above 80 suggest excessive optimism, while below 20 indicate panic selling. For example, Bitcoin’s 2023 rally stalled when MFI hit 85, preceding a 22% correction.
Understanding Chaikin A/D Oscillator
The oscillator compares short-term and long-term accumulation trends. Crosses above zero line signal institutional buying, while dips below hint at distribution phases. During Ethereum’s March 2024 surge, this metric flipped positive two days before prices broke resistance.
| Indicator | Calculation Basis | Key Signal | Use Case |
|---|---|---|---|
| OBV | Cumulative volume flow | Trend confirmation | Early reversal detection |
| MFI | Price/volume ratio | Overbought/oversold zones | Timing exits |
| Chaikin A/D | EMA differentials | Momentum shifts | Spotting institutional moves |
Combining these tools filters out false signals. A rising OBV with Chaikin crossing zero and MFI below 30 creates high-confidence entry points. Always cross-verify with price action to avoid acting on isolated readings.
Practical Tips for Trading with Volume and Liquidity Metrics
Accurate information forms the foundation of successful strategies in fast-moving environments. Distinguishing meaningful signals from noise requires both technical skill and disciplined verification processes. This section outlines actionable methods to enhance decision-making through validated insights.
Recognizing Reliable Data Sources
Platforms with transparent reporting practices reduce risks from manipulated statistics. Focus on exchanges that publish regular audits or partner with third-party validators. These measures help filter out platforms prone to artificial inflation of transaction counts.
Follow these guidelines to strengthen your analysis:
- Cross-check metrics across at least three platforms to spot inconsistencies
- Set minimum thresholds for daily activity levels when evaluating assets
- Compare current transaction intensity against 30-day averages
Significant shifts – typically exceeding 50% of normal ranges – warrant closer inspection. Pair these observations with price action and news catalysts. For example, sudden spikes during quiet periods often indicate speculative activity rather than organic demand.
Implement safeguards like dynamic position sizing based on real-time depth charts. Adjust stop-loss orders during low-activity periods to account for potential slippage. Historical consistency checks help identify assets with stable participation patterns.
Stay informed about regulatory changes or platform updates that might temporarily distort metrics. Tools like real-time news aggregators and community sentiment trackers provide context for unusual movements.
Market Activity and Trading Strategies
Adapting approaches to shifting conditions separates effective participants from reactive ones. Whether using rapid-fire scalping tactics or automated systems, activity metrics serve as foundational inputs. These signals help confirm whether price movements align with genuine momentum or temporary hype.
Sideways phases often test patience, as stagnant valuations suggest indecision. Savvy observers wait for surges that break established ranges – these moments frequently mark strategic entry points. Tools like volume profiles clarify where clusters of past transactions might influence future decisions.
Three principles guide robust plans:
- Match timeframes – day traders prioritize minute-by-minute shifts, while long-term holders focus on weekly trends
- Verify breakouts – confirm range exits with sustained activity spikes across multiple platforms
- Combine tools – overlay real-time data with historical benchmarks to filter false signals
For those refining their methods, analyzing chart patterns alongside participation levels creates clearer decision thresholds. This synergy helps navigate volatile environments while maintaining disciplined risk parameters.


No comments yet