The digital asset space operates in distinct cycles where different asset classes alternate in driving growth. Investors often rotate holdings between established players and newer projects, creating measurable patterns of capital movement. Tracking these shifts helps identify strategic entry and exit points across asset categories.
One key metric for evaluating capital distribution compares an asset’s value against the entire sector’s valuation. When this ratio stays above 60%, it suggests reduced risk appetite as participants favor stability over experimental ventures. Conversely, lower percentages often correlate with increased speculation in emerging projects.
This metric’s movements act as a sentiment gauge, reflecting collective investor psychology. Historical data shows prolonged periods of leadership by either category typically precede market phase transitions. Recognizing these signals enables more informed decisions about portfolio balancing and risk management.
Key Takeaways
- Sector leadership alternates between established and emerging digital assets
- Capital concentration ratios reveal investor risk preferences
- Extended periods of asset class leadership often signal upcoming shifts
- Metric calculations compare individual and total sector valuations
- Historical patterns help anticipate potential market transitions
Overview of Cryptocurrency Market Dominance
The heartbeat of digital asset valuation pulses through a simple ratio comparing individual assets to the entire sector. This measurement acts like a financial compass, guiding investors through shifting capital priorities. When one asset class commands a majority share, it reveals collective confidence in its stability versus experimental alternatives.
Defining Bitcoin Dominance and Its Importance
Bitcoin’s leadership position gets calculated by dividing its value against all digital assets combined. This percentage becomes a critical risk indicator – higher numbers suggest safer bets, while lower figures signal adventurous investments. Traders monitor these shifts to anticipate sector rotations before they occur.
Historical patterns show this metric often peaks during uncertainty. Investors retreat to perceived stability, boosting Bitcoin’s share temporarily. These fluctuations create tactical opportunities for portfolio adjustments across market phases.
The Role of Altcoins in Shaping Market Trends
Alternative digital assets collectively influence sector dynamics through innovation and niche solutions. Their combined value movements create counterpressure to Bitcoin’s dominance. When these projects gain traction, capital flows toward specialized use cases like smart contracts or decentralized storage.
This interplay between established and emerging assets drives sector evolution. Major technological breakthroughs in alternative projects frequently correlate with decreased dominance for older networks. Monitoring these relationships helps identify emerging opportunities before mainstream adoption.
Historical Patterns and Market Cycles
Market cycles in the blockchain space reveal consistent investor behavior patterns. These rhythms show how capital rotates between established networks and newer projects over time. Understanding these shifts helps decode market psychology and potential turning points.
Lessons from Previous Bitcoin Seasons
The 2017-2018 cycle demonstrated how innovation drives capital redistribution. Bitcoin’s share plunged from 80% to 40% as thousands of new projects emerged. Initial coin offerings (ICOs) redirected billions into experimental platforms, creating the first major altcoin season.
This trend reversed sharply when market sentiment cooled. Investors retreated to Bitcoin during the 2018-2020 downturn, pushing its share back above 60%. The flight to stability highlighted its role as a market anchor during turbulent periods.
The 2020-2021 rebound introduced new variables. Decentralized finance (DeFi) platforms and NFT marketplaces siphoned capital from traditional assets. Despite this, Bitcoin gained institutional adoption, creating competing forces in market share dynamics.
Recent patterns show similar defensive positioning. When global liquidity tightened in 2022, alternative assets faced steeper declines than Bitcoin. This repeated behavior confirms its status as a relative safe haven during economic uncertainty.
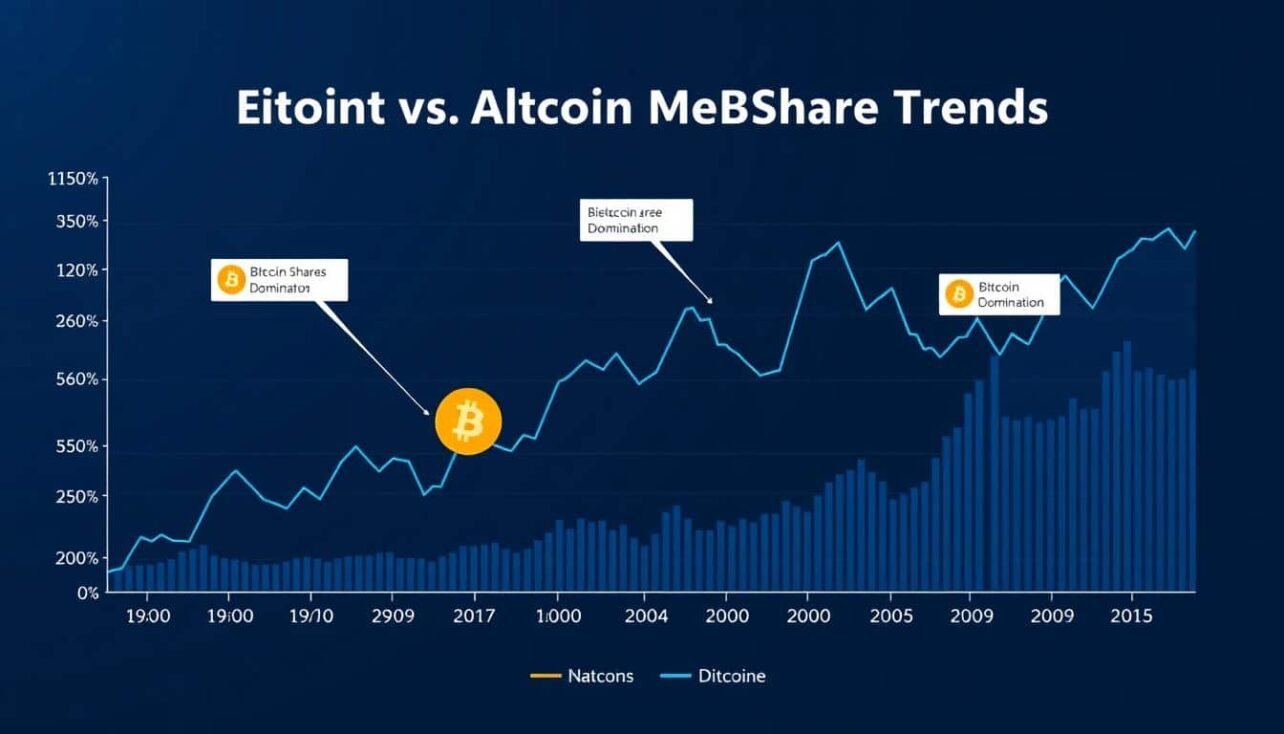
Crypto market dominance analysis Bitcoin vs altcoin market share trends
The balance of power in digital assets remains tilted toward established networks in 2025. With 64% valuation share across the total crypto market, Bitcoin maintains its gravitational pull on sector dynamics. This level historically precedes extended periods where stability-focused investments outperform speculative bets.

Thresholds matter in capital rotation patterns. When the leading asset’s share drops below 60%, traders historically reallocate toward alternative projects. These shifts often align with breakthroughs in blockchain functionality or regulatory milestones favoring niche applications.
Current conditions reveal competing forces. Institutional adoption strengthens Bitcoin’s position, while layer-2 solutions and tokenized assets create opportunities for altcoins. The sustained high dominance level suggests investors prioritize network security over experimental use cases despite advancing technology.
Strategic positioning requires monitoring multiple catalysts. Market share distributions could pivot rapidly with ETF approvals or macroeconomic policy changes. For deeper insights into these dynamics, explore our analysis of shifting investment strategies across asset classes.
Understanding the Bitcoin Season Index
The Bitcoin Season Index offers a clear lens to view capital allocation shifts between major and emerging assets. This specialized tool helps investors identify periods when established networks outperform experimental projects. By tracking performance disparities, traders gain actionable insights for timing entry and exit strategies.

Calculation Methodologies Behind the Index
Analysts determine the index value using a straightforward formula: Bitcoin’s valuation divided by the total sector valuation, multiplied by 100. Most models focus on the top 125 assets to exclude volatile, low-liquidity tokens. This approach ensures balanced representation while minimizing distortion from speculative activity.
A critical threshold emerges when fewer than 25% of alternative assets outperform Bitcoin. Crossing this line signals heightened confidence in established networks. The calculation framework adapts across time horizons, offering layered perspectives on market behavior.
| Time Frame | Sensitivity | Primary Use Case |
|---|---|---|
| Daily | High volatility | Short-term trading signals |
| Weekly | Moderate filtering | Trend confirmation |
| Monthly | Low noise | Strategic allocation decisions |
Interpreting Market Signals and Trends
Extended periods above the 25% threshold often precede capital rotations toward safer assets. Traders combine multiple time frames to distinguish noise from meaningful trend reversals. Weekly readings provide optimal balance between responsiveness and reliability for most strategies.
When the index remains elevated for 90+ days, historical data suggests increased probability of sector-wide risk aversion. These conditions typically favor Bitcoin-centric portfolios until altcoins demonstrate sustained outperformance.
Current Market Conditions and 2025 Performance
Mid-2025 paints a clear picture of shifting priorities across digital asset portfolios. Bitcoin’s 10% year-to-date growth contrasts sharply with double-digit declines among most alternative assets. This divergence highlights investor confidence in established networks during uncertain market conditions.

XRP stands as the lone exception among major tokens, climbing 12% since January. Meanwhile, Ethereum’s 30% drop reflects reduced demand for smart contract platforms. Other popular assets like Chainlink and Dogecoin face even steeper losses, exceeding 20% declines.
| Asset | 2025 Performance | Market Position |
|---|---|---|
| Bitcoin (BTC) | +10% | 64% dominance |
| XRP | +12% | Regulatory clarity beneficiary |
| Ethereum (ETH) | -30% | Smart contract sector leader |
| Top 10 Altcoins | -20% to -35% | Speculative segment |
The Altcoin Season Index’s plunge to 41 confirms prolonged bitcoin dominance patterns. Historical data shows such levels typically precede extended periods favoring core assets. This environment rewards portfolios weighted toward network security over experimental use cases.
Institutional adoption and macroeconomic factors strengthen Bitcoin’s position, while alternative projects await regulatory breakthroughs. For those monitoring potential shifts, our altcoin season predictions provide strategic insights for upcoming quarters.
Evolution of Bitcoin and Altcoin Market Shares
From its unchallenged beginnings, Bitcoin’s role has evolved alongside emerging competitors. What began as a single-asset ecosystem now features thousands of projects vying for attention. This transformation reflects both technological progress and changing investor sentiment across economic cycles.

Historical Catalysts for Capital Redistribution
Major events consistently reshape valuation distributions. The 2017 ICO boom saw Bitcoin’s share drop below 40% as capital flooded new projects. Conversely, 2022’s economic uncertainty pushed its dominance back above 65% as risk appetite vanished.
| Event | Year | Bitcoin Share Change | Investor Response |
|---|---|---|---|
| ICO Boom | 2017 | -55% | Speculative frenzy |
| DeFi Summer | 2020 | -22% | Yield-seeking behavior |
| Regulatory Clampdown | 2022 | +28% | Safe-haven demand |
| ETF Approvals | 2024 | +18% | Institutional inflows |
Technological breakthroughs often trigger market shifts. Smart contract platforms eroded Bitcoin’s dominance by enabling new financial tools. However, each innovation ultimately expanded the total cryptocurrency valuation, benefiting all participants.
Recent data shows a delicate balance. While altcoins capture niche applications, Bitcoin remains the preferred anchor during volatility. This dynamic creates cyclical patterns where investors rotate holdings based on risk tolerance and sector maturity.
The Science Behind Dominance Calculations
Accurate measurement of digital asset influence requires precise calculation frameworks. Analysts filter out stablecoins and derivative tokens when determining total crypto valuations, ensuring metrics reflect real price movements rather than artificial inflation from pegged assets.
Time frame selection dramatically impacts interpretation. Daily snapshots capture volatility but often mislead, while weekly averages smooth out noise. Monthly trends reveal structural shifts in capital allocation patterns across networks.
- Exclusion criteria eliminate assets with tied valuations
- Three-month rolling averages detect sustained trends
- Real-time calculations prioritize liquid, established tokens
Advanced platforms combine these metrics with transaction volume and holder distribution data. This multi-layered approach creates reliable frameworks for assessing network health and investor confidence. Traders using these refined models gain clearer signals for portfolio adjustments.
For deeper insights into interpreting these metrics, explore our bitcoin dominance analysis guide. It details how professionals integrate valuation data with macroeconomic indicators for enhanced decision-making.
Institutional Influences and Regulatory Impacts
Traditional finance now plays a decisive role in shaping digital asset valuations. Recent policy shifts and investment vehicles have redirected capital flows, favoring established networks over speculative alternatives. This institutional pivot creates lasting effects on valuation distributions across the sector.
ETF Approvals and Political Shifts
Bitcoin ETFs have funneled over $50 billion into the asset since 2024, according to North America’s institutional adoption trends. These products lowered entry barriers for conservative investors, cementing Bitcoin’s position as a core holding. Analysts link this surge to revised price targets exceeding $200,000 by late 2025.
Political developments amplified these trends. The 2024 U.S. election brought leadership favoring clear digital asset frameworks. Reduced regulatory ambiguity encouraged institutional participation while cooling enthusiasm for riskier altcoin ventures.
These factors combine to sustain Bitcoin’s valuation share above historical averages. As traditional finance deepens its sector involvement, market dynamics increasingly reflect institutional priorities rather than retail speculation.


No comments yet