Now Reading: Today’s Bitcoin Price Analysis and Forecast Update
- 01
Today’s Bitcoin Price Analysis and Forecast Update
Today’s Bitcoin Price Analysis and Forecast Update

The digital asset landscape remains dynamic, with the premier cryptocurrency maintaining its dominant position. This comprehensive analysis delivers a clear snapshot of the current market environment.
As of the latest data, the valuation for BTC stands at a significant level. It has demonstrated notable growth from its annual low while navigating a pullback from its peak. This activity highlights the asset’s inherent volatility.
Our examination synthesizes multiple analytical frameworks. We incorporate technical indicators, volume assessment, and macroeconomic factors. The goal is to provide actionable insights for a diverse range of market participants.
Understanding the present context is crucial for evaluating risk and opportunity. This report offers specific projections, from short-term movements to long-term potential, helping you make informed decisions.
Market Overview and Current Price Trends
Market dynamics for the flagship digital currency indicate a stabilization pattern after significant upward movement. This consolidation phase reflects the asset’s inherent volatility while establishing new trading ranges.
Current Price Snapshot
The digital asset currently trades at $111,254 USD, showing a 5.66% increase over the past week. Despite a minor 1.31% monthly decline, the cryptocurrency maintains substantial market cap strength at $2.215 trillion.
With 19,939,100 BTC in circulation, the asset demonstrates resilience through 57% positive trading days. This underlying strength suggests buyer support persists at current valuation levels.
Investor Sentiment & Trend Movements
Current sentiment metrics reveal cautious market behavior. The Fear & Greed Index registers 30, indicating fear dominates investor psychology. However, technical indicators suggest 42% bullish market sentiment.
Recent trend movements show the asset testing resistance zones while maintaining critical support. The moderate 4.85% volatility signals potential market maturation compared to historical standards.
Understanding these price and sentiment dynamics provides valuable context for strategic positioning. Current conditions may present opportunities for investors considering long-term perspectives.
Understanding Technical Analysis Signals
Examining key technical signals provides a systematic approach to understanding market movements across different timeframes. These quantitative tools help traders identify patterns and potential turning points.
Moving Averages & RSI Insights
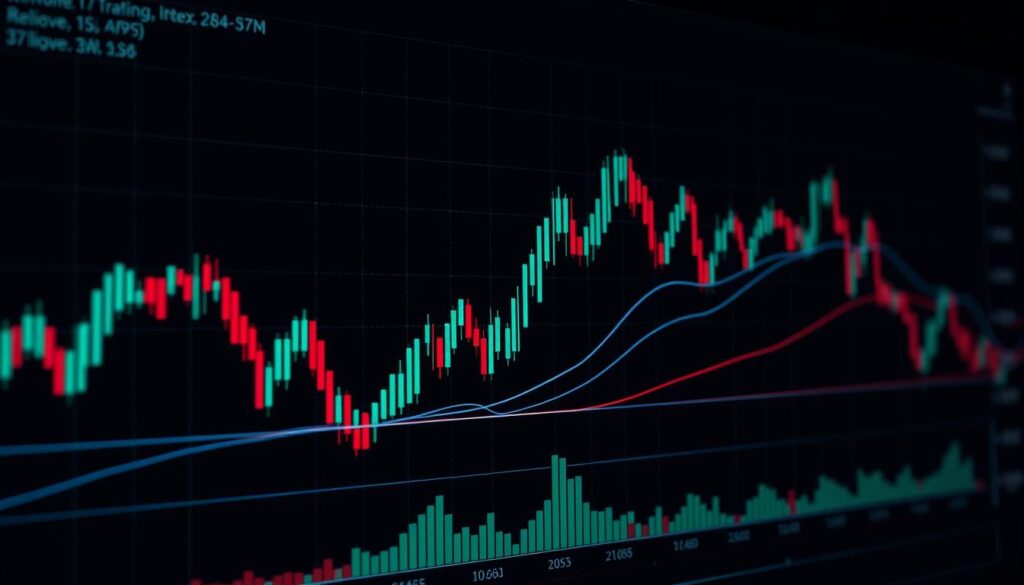
The 50-day and 200-day moving averages serve as critical benchmarks for trend identification. Current data shows bullish alignment on weekly and daily chart timeframes.
However, the RSI curve displays a falling trend despite stable valuation levels. This bearish divergence suggests weakening momentum that could signal upcoming pressure.
Volume and Liquidity Dynamics
Volume patterns play a crucial role in validating price movements. The current negative volume balance across multiple periods indicates selling pressure dominates on high-volume days.
This technical analysis approach helps traders align strategies with prevailing market forces. Understanding these indicators provides valuable context for decision-making.
Bitcoin price analysis today forecast
Algorithmic predictions indicate a bullish trajectory for BTC in the immediate future. Our models project a 7.42% increase to $119,506.07 within the next 24 hours, with continued upward movement expected.
The prediction shows progressive gains over seven days, potentially reaching $125,444.50 by October 29th. This represents a 12.76% increase from current valuation levels.
These projections combine quantitative models with technical chart patterns and machine learning algorithms. The methodology analyzes historical patterns, volume trends, and broader market correlations.
Traders should view these forecasts as probabilistic scenarios rather than certainties. Market conditions can change rapidly due to unexpected news or large transactions.
Risk management remains essential when acting on any prediction. Stop-loss orders and proper position sizing help navigate the inherent volatility of digital assets.
The projected path includes slight consolidation after the peak, reflecting normal profit-taking behavior. This pattern typically follows strong upward moves in cryptocurrency markets.
Short Term Market Dynamics
Focusing on the immediate horizon, the market’s current state is characterized by a horizontal trading range. This pattern offers distinct signals for day-to-day activity.

Intraday Price Movements
The established boundaries are clear. Support sits firmly at 109,600 points, while resistance caps advances at 115,500. These levels create a defined range for active participants.
Movement within this channel shows relative calm. Single-day volatility measures a contained 1.64%. This suggests quieter conditions for intraday strategies.
Over a slightly longer period of five days, volatility expands to 5.54%. This reflects the asset’s tendency for periodic swings.
A key concern is the negative volume balance. High-volume trading days often correlate with downward price pressure. This signals potential weakness.
The collective technical assessment for the next one to six weeks is slightly negative. The score of -38 indicates limited upside potential near the current price level.
Breakouts above resistance or breakdowns below support will be critical. They will likely dictate the next significant directional move for short-term trading.
Medium Term Trend Observations
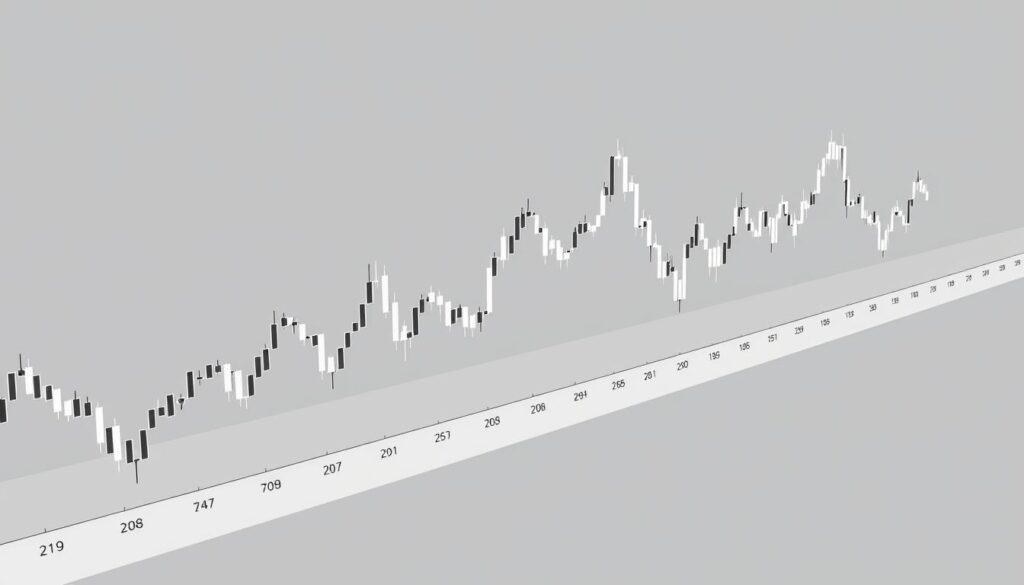
Medium-term technical patterns for BTC reveal a significant shift in market structure as the asset tests critical support levels. The breakdown from the rising trend channel suggests a transition phase rather than immediate bearish reversal.
Critical support at the 106,000 level represents a pivotal zone for maintaining bullish structure. Failure to hold this area could trigger additional technical selling pressure.
Horizontal and Rising Trend Channels
The emerging horizontal pattern reflects natural market behavior after sustained advances. This consolidation allows new participants to enter while early investors secure profits.
Current volatility metrics illustrate the expanding price dispersion that accompanies trend transitions. These conditions create both risks and opportunities for position traders.
| Timeframe | Volatility | Liquidity | Change |
|---|---|---|---|
| 22-day | 14.69% | 33,326.31 | -7.68% |
| 66-day | 30.26% | 24,996.14 | -2.18% |
Despite near-term weaknesses, the medium-term assessment remains slightly positive with a score of 28. The one-to-six month recommendation suggests maintaining exposure for patient investors.
Traders should monitor the interaction between price and the 106,000 support closely. BTC’s response to this zone will likely determine the next directional move in coming months.
Long Term Investment Perspectives
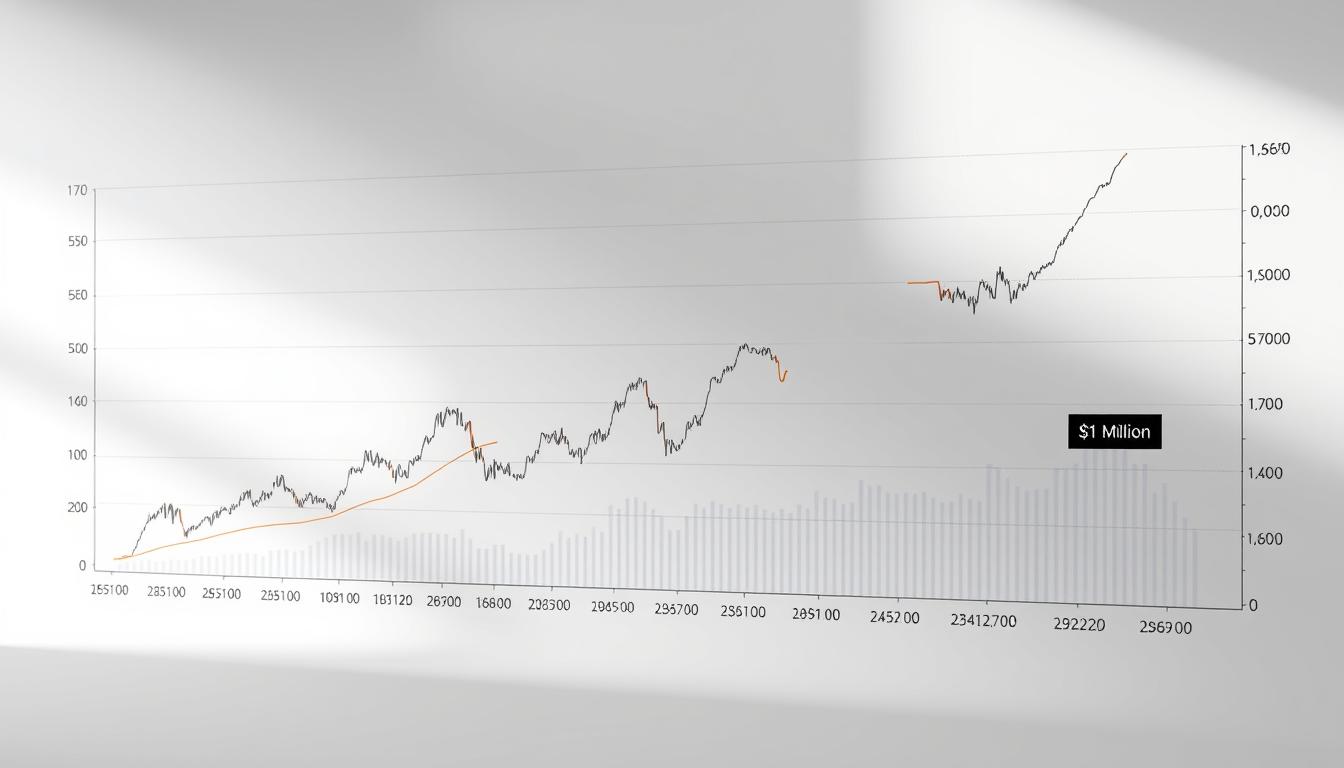
Long-term investment horizons reveal BTC’s remarkable journey from digital novelty to established asset class. This perspective helps investors understand the asset’s fundamental characteristics beyond short-term fluctuations.

Historical Price Context
The cryptocurrency’s history shows consistent appreciation over extended periods. Early adopters who maintained positions through market cycles witnessed substantial returns despite temporary setbacks.
BTC operates within a clear rising trend channel over multi-year timeframes. This pattern indicates growing investor interest and positive development. The asset’s scarcity contributes to this long-term upward trajectory.
Current technical assessment places the currency between support at 107,000 and resistance at 124,000 points. A decisive break through either level would signal the next directional move. The negative volume balance suggests some near-term weakness.
| Timeframe | Technical Assessment | Recommendation | Score |
|---|---|---|---|
| 1-6 Quarters | Neutral | Hold | 22 |
| Multi-Year | Rising Trend | Accumulate | Positive |
Patient investors with multi-year horizons have historically been rewarded. The current neutral assessment suggests maintaining exposure while monitoring key support levels. This balanced approach acknowledges both long-term potential and near-term challenges.
Seasonal Price Predictions
Examining decade-long seasonal trends provides a probabilistic framework for anticipating market movements. This approach identifies recurring patterns that often emerge during specific calendar periods.
Seasonal prediction models analyze historical data across multiple years. They reveal how assets typically behave during certain months. This history helps set realistic expectations.
Standard Deviations and Historical Data Patterns
Standard deviation measurements show the range of possible outcomes. One standard deviation covers about 68% of historical results. Two deviations capture nearly 95% of past behaviors.
The ten-year average development provides a baseline for comparison. Current positioning relative to this average indicates potential direction. Markets often revert to mean levels over time.
Historical patterns from 2016 to 2025 include complete market cycles. This robust data set identifies persistent seasonal tendencies. The patterns often transcend individual cycle characteristics.
Investors should view seasonal prediction as guidance rather than guarantee. Unexpected events can override typical patterns. Combining this approach with other methods creates balanced strategies.
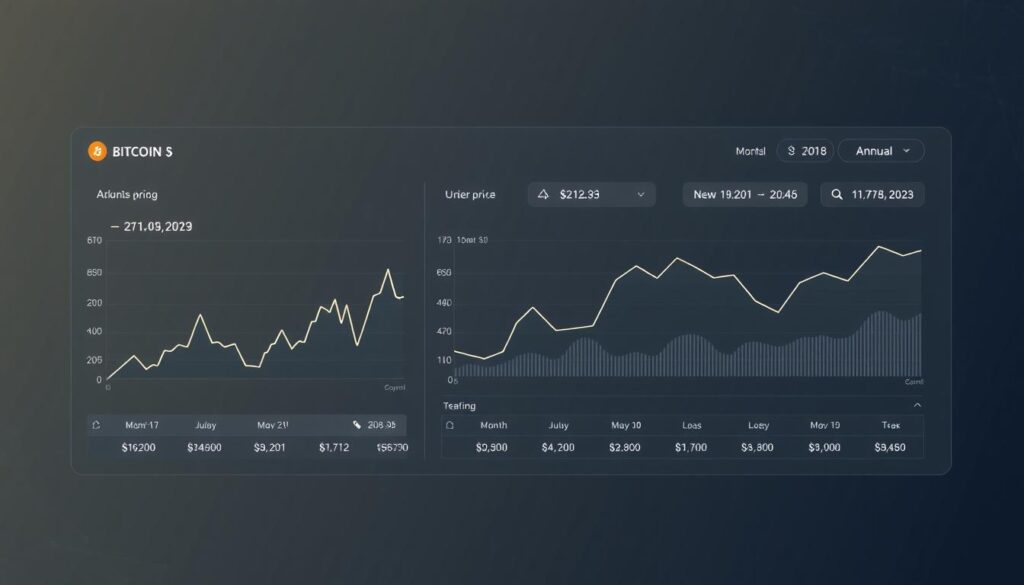
Monthly and Annual Price Statistics
Historical data spanning multiple years provides valuable insights into recurring market behaviors across different timeframes. This statistical approach reveals patterns that often repeat despite changing market conditions.

The examination of monthly performance metrics shows distinct seasonal tendencies. Certain periods consistently demonstrate stronger returns than others throughout the calendar year.
Data Analysis Across Years
Analysis across ten years reveals that btc exhibits predictable monthly patterns. The average development per month shows consistent outperformance during specific quarters.
Annual statistics from 2016 to 2025 capture the asset’s evolution through different market phases. This long-term perspective helps investors understand cyclical behaviors.
| Month | Average Return (%) | Positive Months | Volatility |
|---|---|---|---|
| January | +8.2 | 7/10 | High |
| April | +12.5 | 8/10 | Medium |
| July | +3.1 | 6/10 | Low |
| October | +9.8 | 7/10 | Medium |
| December | +15.3 | 9/10 | High |
The ten-year average smooths out short-term fluctuations. This reveals underlying rhythms that help with strategic positioning for btc investments.
Year-over-year comparisons show characteristic market cycles. Understanding these patterns helps investors navigate changing prices more effectively.
Influence of Global Economic Indicators
The relationship between traditional economic metrics and digital asset performance has strengthened significantly. Major currencies now respond to the same macroeconomic forces that shape traditional markets.
Impact of Macroeconomic Trends on BTC
Recent Consumer Price Index data shows persistent inflation pressures. This environment tests BTC’s role as an inflation hedge. Capital may flow toward scarce digital assets when fiat currencies weaken.
Central bank policies create complex dynamics for the cryptocurrency market. Higher interest rates typically pressure speculative assets. However, institutional adoption continues to validate the space.
| Economic Indicator | Impact on BTC | Timeframe | Strength |
|---|---|---|---|
| CPI Data | Positive (inflation hedge) | Short-term | Medium |
| Interest Rates | Negative (opportunity cost) | Medium-term | Strong |
| Trade Policies | Mixed (inflation vs growth) | Variable | Weak |
| Institutional Adoption | Positive (validation) | Long-term | Strong |
JPMorgan’s planned cryptocurrency-backed loans signal deeper market integration. This development supports BTC’s price stability during economic uncertainty. The asset serves dual roles in different market conditions.
Impact of Insider Trades and Volume Data
Large holder activity provides unique signals for understanding market direction that aren’t available in traditional investments. Tracking whale movements through blockchain analytics offers unprecedented visibility into accumulation and distribution patterns.

Volume Balance Overview
The current volume balance across all timeframes shows concerning signals. Data reveals negative readings for 1-day, 5-day (-95.13), 22-day (-56.65), and 66-day (-28.34) periods.
This pattern indicates selling pressure dominates during high-volume sessions. Buying activity occurs on lighter trading days, which typically signals distribution rather than accumulation.
Major exchanges provide aggregated data that helps distinguish genuine liquidity from artificial figures. Transparency in market activity is crucial for accurate assessment.
Research from Investtech shows assets with positive volume balance above 40 generate meaningful excess returns. This metric demonstrates predictive power in cryptocurrency markets as well.
When large btc holders resume accumulation, the currency often experiences significant upward movement. Their trading decisions create ripple effects across all exchanges.
Monitoring volume patterns at different price levels identifies key support and resistance zones. These areas represent previous high-activity points where participants may defend positions.
Comprehensive Investor Psychology Analysis
Investor psychology often drives market movements more powerfully than fundamental factors. Emotional responses like fear and greed create predictable patterns that can override rational valuation.
The Fear & Greed index currently reads 30, indicating significant fear dominates market psychology. Historically, such extreme fear levels have presented contrarian opportunities to buy during temporary weakness.
Behavioral finance research identifies systematic errors in decision-making. Investors frequently exhibit loss aversion and recency bias. These patterns create predictable market reactions that sophisticated participants can anticipate.
Technical indicators show divided sentiment with 42% bullish positioning. This balanced reading suggests neither bulls nor bears control the crypto landscape currently. The contested environment awaits decisive price action.
Investtech’s academic research, developed with Oslo University, validates these psychological patterns. Their work demonstrates clear causation between sentiment indicators and future returns in cryptocurrency markets.
Understanding mass psychology enables strategic investment positioning against prevailing extremes. The integration of behavioral analysis with technical tools creates a comprehensive framework for crypto investment decisions.
Quantitative Analysis and Scientific Methods
Statistical frameworks transform subjective market observations into objective investment signals. This approach applies mathematical rigor to financial markets.
Quantitative techniques rely on measurable criteria that can be tested across large datasets. They create reproducible systems for market analysis.
Statistical Approaches in Market Forecasting
Investtech’s research dating to 1993 demonstrates the power of systematic methods. Their studies show rising trend channels generated 7.8% annual excess returns across 34,880 cases.
Momentum strategies also proved effective. Assets with strong momentum outperformed by 11.4 percentage points annually. This confirms persistent market patterns.
The cryptocurrency asset class presents unique challenges for quantitative prediction. Limited historical data and structural events like halvings complicate modeling.
Despite these challenges, scientific methods provide valuable forecast frameworks. They balance statistical rigor with market context for btc valuation.
Daily analysis of 28,000+ securities reveals patterns invisible in smaller datasets. This big data approach generates competitive edges in volatile markets.
Trading Strategies in a Volatile Market
Navigating volatile markets demands specific trading strategies that balance opportunity with risk. The current environment shows volatility escalating from 1.64% daily to 30.26% over 66 days. This pattern requires adaptive approaches.
Range-bound techniques work well during consolidation phases. Traders can buy near support at 109,600 and sell near resistance at 115,500. Exiting when price breaks beyond this range protects against false signals.
Risk and Reward Management Techniques
Proper risk management separates successful traders from others. Position sizing should limit any single trade to 1-2% of capital. Stop-loss orders define maximum acceptable loss before entering positions.
Reward-to-risk ratios provide quantitative frameworks for evaluation. Professional traders typically seek minimum 2:1 setups. This means potential profit should double potential loss.
An example trade might involve entering at 109,800 with stops at 108,500. Profit targets at 114,500 create a 3.6:1 ratio. This structured approach works within established ranges.
Diversification across timeframes and strategies reduces portfolio volatility. Combining different approaches creates multiple uncorrelated return streams. This trading discipline turns market turbulence into advantage.
The cryptocurrency asset class offers unique opportunities for disciplined participants. Another example involves breakout strategies above resistance levels. Each asset requires tailored risk parameters.
Cryptocurrency Market News and Updates
Breaking news from major financial institutions creates new dynamics for digital asset valuation. Recent announcements highlight significant institutional adoption that could reshape market structures.
JPMorgan’s plan to offer crypto-backed loans represents a major validation milestone. This development shows traditional finance embracing digital assets as legitimate collateral. The institutional acceptance provides fundamental support beyond technical patterns.
Large holder behavior remains a critical market driver. Recent analysis suggests accumulation by major participants could push valuations to new highs. Whale activity often signals sustainable momentum rather than temporary spikes.
| News Event | Market Impact | Timeframe |
|---|---|---|
| JPMorgan Crypto Loans | Institutional Validation | Long-term |
| Whale Accumulation Signals | Supply Pressure | Medium-term |
| European Market Wrap | Global Sentiment | Immediate |
| Retail Demand Stability | Price Foundation | Ongoing |
The current crypto landscape shows strength from professional rather than retail participation. This suggests more strategic capital deployment. The market maintains resilience around key technical levels.
Monitoring credible news sources helps distinguish meaningful developments from market noise. Integrating fundamental events with technical analysis creates comprehensive understanding. This approach balances catalyst identification with price level validation.
Technical and Fundamental Analysis Integration
Successful investment strategies often emerge from the thoughtful combination of quantitative technical indicators and qualitative fundamental drivers. This integrated approach addresses both market timing and asset valuation simultaneously.
Combining Strategies for Accurate Forecasting
Technical methods excel at identifying optimal entry and exit points through chart patterns and momentum signals. Fundamental assessment determines intrinsic value based on underlying properties and adoption trends.
The digital currency’s fixed supply of 21 million coins creates programmatic scarcity. This contrasts sharply with traditional currencies subject to arbitrary expansion.
Current circulation stands at 19,939,100 units, representing 95% of total eventual supply. Remaining coins enter through predictable mining schedules.
Investtech research demonstrates clear causation between technical factors and future returns. Their studies validate integration frameworks for improved prediction accuracy.
Combining approaches creates balanced forecast methodologies. Neither method alone provides complete market perspective. The integration acknowledges market complexity while avoiding over-reliance on single dimensions.
This holistic framework supports more reliable value assessment and timing decisions. It transforms subjective observations into systematic investment processes.
Conclusion
Balancing short-term technical signals with long-term fundamental drivers creates a holistic framework for cryptocurrency investment. This comprehensive approach considers multiple time horizons and risk profiles.
The current bitcoin price analysis reveals distinct opportunities across different periods. Short-term challenges coexist with medium-term potential and long-term stability.
This digital asset offers unique value through its fixed supply and growing adoption. Investors should consider their individual tolerance when deciding to buy bitcoin.
Major exchanges provide essential infrastructure for market participation. The week ahead may prove pivotal for near-term direction.
By the end of this period, clearer signals should emerge. This example demonstrates how integrated analysis supports informed decisions.
Market cap strength and fundamental properties provide underlying support. Strategic positioning requires balancing conviction with flexibility.


