Navigating the fast-paced world of digital currency can be challenging. Prices move quickly, and it’s often hard to tell a real trend from a temporary spike. This guide introduces a powerful method for traders.
We focus on how trading activity, measured by volume, confirms when a major price move is genuine. This confirmation is key to making smarter decisions. It helps you act on real momentum, not just market noise.
When an asset’s price pushes through a critical level, the amount of activity behind that move matters. High participation suggests strong conviction. This separates meaningful shifts from false alarms.
Mastering this approach allows for more disciplined strategies. You can better time your entries and exits. This is especially valuable in the U.S. market, where significant global trading occurs.
Introduction to Bitcoin Breakout Analysis Volume Confirmation
Understanding when a cryptocurrency transitions from consolidation to directional movement is crucial for traders. This section explores the core concepts that form the foundation of effective market analysis.
Defining Breakouts and Their Importance
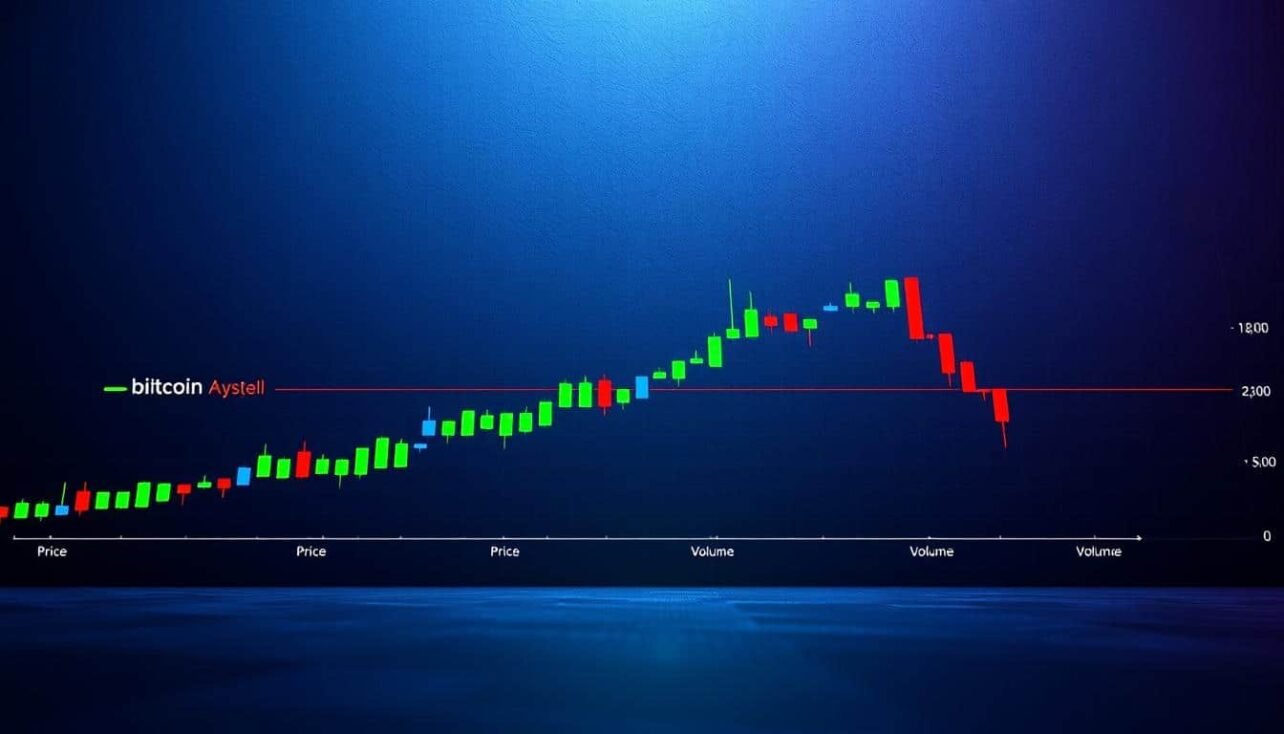
Breakouts represent critical moments when an asset’s price moves beyond established boundaries. These boundaries are typically resistance or support levels that have contained previous price action.
When prices push above resistance, it signals bullish momentum. Conversely, breaking below support indicates bearish pressure. These transitions offer clear signals for market participants.
The Role of Volume in Crypto Trading
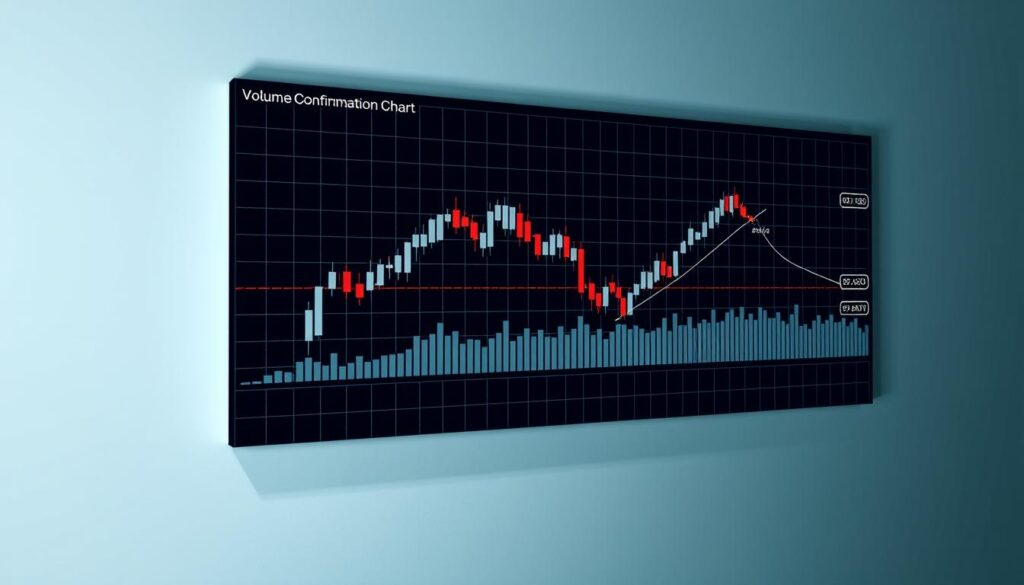
Volume measures the total activity behind price movements. High participation levels validate the strength of any breakout. This separates genuine trends from temporary fluctuations.
Traders use volume data to confirm their analysis. Significant trading activity during breakouts suggests strong conviction. This approach helps filter market noise and identify sustainable moves.
Fundamentals of Bitcoin Price Movements and Trading Volume
Market efficiency in digital assets depends significantly on the relationship between trading activity and price formation. This connection forms the bedrock of reliable market evaluation.
Transaction levels directly influence how easily assets can be bought or sold. High participation creates smooth execution environments.
Understanding Market Liquidity and Price Trends
Liquidity measures how quickly positions can be entered or exited without major price disruptions. It correlates directly with trading volume levels.
Sustainable trends typically show increasing volume as prices move directionally. This indicates broad market support for the movement.
Conversely, price changes on declining volume often signal weak conviction. Such moves may reverse quickly due to lack of participant commitment.
| Volume Level | Price Movement | Market Interpretation | Likely Outcome |
|---|---|---|---|
| High Volume | Upward Trend | Strong buying interest | Trend continuation probable |
| High Volume | Downward Trend | Significant selling pressure | Further decline likely |
| Low Volume | Upward Movement | Weak conviction | Potential reversal |
| Low Volume | Downward Movement | Exhausted selling | Possible bottom formation |
Understanding these relationships helps traders distinguish between meaningful price movements and temporary fluctuations. Proper volume analysis provides crucial context for market decisions.
Bitcoin breakout analysis volume confirmation
Market participants need objective criteria to distinguish genuine trends from temporary fluctuations. This section explores how trading activity data provides the validation needed for confident decision-making.
Verifying Price Moves Through Volume Data
The reliability of any significant price shift depends on accompanying market participation. When an asset moves beyond key levels, the amount of trading activity becomes crucial evidence.
A common benchmark requires activity levels to exceed the 20-period average by at least 30%. This threshold separates meaningful moves from weak attempts. The 1.3x multiplier serves as a reliable filter.

This approach combines three validation elements for stronger signals. Price movement, trend direction, and participation levels must align. This triple-check system significantly reduces false alarms.
Traders establish clear criteria before entering positions. They wait for sufficient market support behind price changes. This disciplined method prevents reaction to every minor fluctuation.
| Volume Level | Price Action | Market Interpretation | Trader Action |
|---|---|---|---|
| 1.5x Average or Higher | Breakthrough Resistance | Strong Conviction | Confident Entry |
| 1.3x to 1.5x Average | Support Break | Moderate Support | Cautious Position |
| Below 1.3x Average | Boundary Test | Weak Participation | Wait for Confirmation |
| Declining Volume | Price Movement | Fading Interest | Avoid Entry |
The strength of market moves correlates directly with participation spikes. Larger activity surges indicate greater conviction and sustainability. Marginal increases suggest tentative movements prone to reversal.
Tools and Technical Indicators for Breakout Analysis
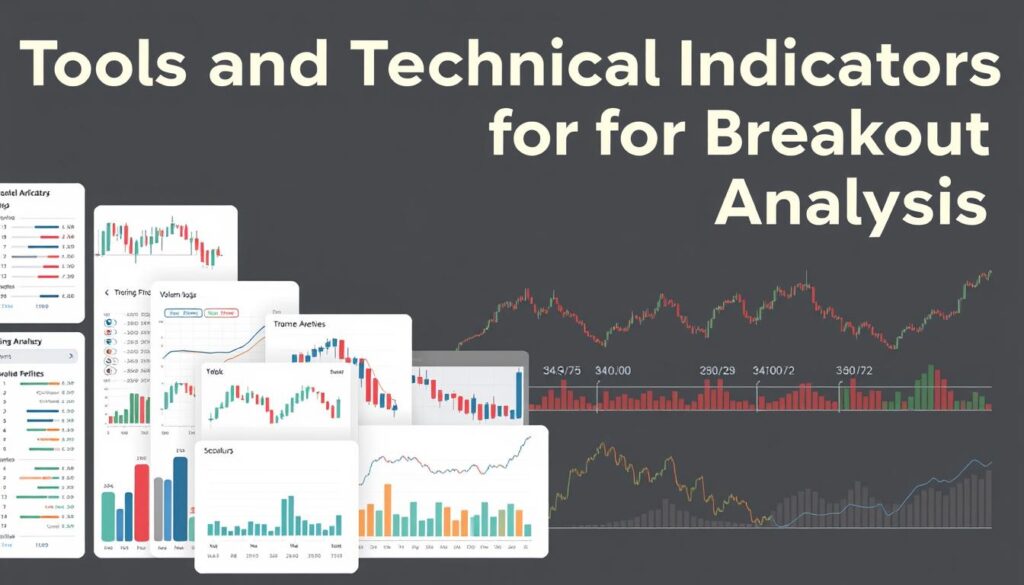
The use of multiple technical indicators creates a robust framework for confirming market shifts. These tools help traders filter noise and identify high-probability setups.

Different types of indicators serve complementary purposes in market evaluation. Some measure trend direction while others assess momentum or volatility.
Moving Averages and RSI for Trend Direction
Moving averages smooth price data to reveal underlying trend direction. The 20-period and 50-period exponential moving averages serve as effective trend filters.
When prices trade above both averages, it suggests bullish momentum. The Relative Strength Index complements this by measuring the rate of price changes.
RSI readings above 70 indicate overbought conditions. Values below 30 suggest oversold territory. This momentum indicator helps gauge the strength of potential moves.
Utilizing Bollinger Bands and Volume Spikes
Bollinger Bands provide volatility-based signals through dynamic expansion and contraction. These bands widen during high volatility and narrow during consolidation.
Price movement beyond band boundaries signals potential breakout points. However, volume confirmation remains essential to validate whether the move represents genuine momentum.
Traders look for volume increases of 1.3x or greater relative to recent averages. This combination of technical tools creates reliable confirmation points for trading decisions.
Applying Real-World Examples in Crypto Trading
Real market events from recent years demonstrate how volume validation works in practice. Studying these patterns helps traders recognize genuine momentum shifts.
Case Study: The 2021 Bull Run
During early 2021, digital asset values experienced a significant surge. The substantial increase was supported by heavy trading activity across exchanges. This buying pressure validated the upward trend as legitimate.
Institutional participation became evident through investment vehicle inflows. The consistent high activity provided clear confirmation of market conviction. This example shows how sustained participation drives major moves.

Ethereum’s Market Movements in Early 2023
Another prominent digital asset showed similar validation patterns in 2023. Its appreciation coincided with growing adoption and network upgrades. Strong trading activity backed this price movement.
The correlation between fundamental developments and participation levels became apparent. Traders could observe how narrative-driven moves gained substance through volume support. This time period offered valuable insights into sustainable breakouts.
These historical examples teach important lessons about market behavior. Recognizing the signature of genuine moves versus false signals becomes easier with practice. Studying past events builds confidence for current decision-making.
Integrating Volume Analysis with Trading Strategies
Sophisticated market participants understand that individual technical tools provide useful signals, but integrated systems deliver superior results. Combining multiple elements creates a robust framework for decision-making.
This approach transforms isolated observations into cohesive trading plans. Multiple confirmation points must align before committing capital to opportunities.
Combining Indicators for Strong Confirmation
Layered confirmation systems significantly enhance signal reliability. For example, a moving average crossover occurring with increased activity provides stronger validation than either indicator alone.
Pairing momentum readings with volatility signals establishes multi-dimensional filters. This requires price, momentum, and participation to align in the same direction.
Such combinations dramatically reduce false alarms by establishing clear hierarchies among indicators. Primary triggers like price movements require secondary filters for validation.

Adjusting Strategies with ATR and EMAs
Average True Range integration enables dynamic risk management within trading strategies. ATR-based stop-loss placement automatically adjusts to current market conditions.
This maintains consistent risk-reward ratios across different volatility environments. Take-profit targets similarly adapt to capture larger gains during active periods.
Exponential Moving Averages serve dual purposes in integrated approaches. They filter trade direction while providing dynamic support levels for position management.
Adjustable parameters including EMA periods and multiplier thresholds allow optimization for specific instruments. Traders can tailor their approach to individual risk preferences.
Overcoming Challenges and Optimizing Breakout Strategies
Even the most carefully constructed trading systems face the challenge of false signals and market noise. These deceptive moves can trigger stop-losses and erode profits. Traders need robust methods to filter genuine opportunities from temporary fluctuations.
Managing False Breakouts and Market Noise
False moves occur when price briefly crosses key levels before reversing. This often traps traders who enter too early. Implementing stricter confirmation criteria helps avoid these pitfalls.
Requiring price to hold beyond resistance or support for a minimum time period adds protection. Many traders use a 5-minute holding rule. This simple filter eliminates many whipsaw movements.
Enhanced volume requirements provide another layer of security. During uncertain periods, raising thresholds from 1.3x to 1.5x average activity improves signal quality. This adjustment responds to current market conditions.
Volatility filters help traders adapt their approach. Widening stop-loss distances during active periods prevents premature exits. Tighter parameters work better during calm markets.
Trend strength indicators like ADX distinguish between strong moves and range-bound conditions. Candlestick patterns offer additional confirmation. Bullish engulfing patterns on upward moves show strong conviction.
Continuous optimization through backtesting identifies robust parameter combinations. Dynamic adjustment systems modify requirements based on market readings. This ongoing refinement creates more reliable strategies over time.
Conclusion
Market participants who combine multiple technical tools create a significant advantage in volatile trading environments. This integrated approach transforms random guesses into calculated decisions.
Mastering the relationship between price shifts and market activity separates successful traders from the crowd. It provides a clear framework for action. This method turns emotional reactions into disciplined strategy.
Sustainable trading requires validating every move with solid data. Proper volume analysis confirms whether market participation supports price direction. This confirmation prevents costly mistakes.
The journey from novice to proficient trader is achievable through consistent practice. Applying these principles leads to better timing and stronger results. Ultimately, this systematic approach builds confidence and improves performance over time.


No comments yet