After a major price drop, the digital asset market often enters a quiet period. This stage is crucial for long-term success. It’s when smart money begins to build positions without causing a big stir.
During this time, values tend to trade within a narrow band. This creates a base formation that technical analysts watch closely. The equilibrium between supply and demand allows large players to accumulate assets steadily.
This period is a key part of the larger crypto market cycle. Recognizing it can provide a significant edge. It often occurs when general sentiment is still negative or uncertain.
This guide will help you spot the signs of this important market stage. You will learn how to identify the patterns and use strategic approaches. The goal is to position yourself advantageously before the next major move.
Introduction to Crypto Market Phases
Market cycles are a fundamental concept, appearing in every financial ecosystem from stocks to digital currencies. These recurring patterns emerge from the collective psychology of participants and broader economic conditions. Recognizing these phases is crucial for navigating the volatile landscape.
Understanding Market Cycles and Trends
The digital asset market cycle typically consists of four distinct stages. This framework helps make sense of price movements over extended periods. The average length for these cycles is often around four years.
Key factors influencing these cycles include Bitcoin’s correlation with other assets and major events like halvings. Social sentiment from influential figures also plays a significant role. These elements create unique catalysts not always seen in traditional markets.
| Phase | General Sentiment | Primary Characteristic |
|---|---|---|
| Accumulation | Uncertainty / Negativity | Price stabilization after decline |
| Markup (Bull Market) | Optimism / Euphoria | Sustained upward price trend |
| Distribution | Complacency | Selling near market peaks |
| Markdown (Bear Market) | Fear / Panic | Sustained downward price trend |
Context for Accumulation and Consolidation
Each phase has clear characteristics in price action, volume, and sentiment. Skilled traders learn to interpret these signs. This knowledge allows for better strategy adjustment based on prevailing market conditions.
Understanding where the market stands in this cycle provides immense context. It helps distinguish between a period of quiet building and one of explosive growth. This insight is a powerful tool for any participant in the crypto market.
What is Crypto Price Consolidation Accumulation Phase?
The transition from bearish sentiment to potential recovery often manifests as a sideways trading pattern with reduced volatility. This stage represents a critical juncture where informed participants begin establishing positions while general interest remains subdued.
Defining Key Characteristics
This market stage features assets trading within a well-defined range after significant declines. The pattern creates a base formation that technical analysts monitor closely. Support levels are repeatedly tested without breaking lower.
Trading activity typically diminishes compared to previous downward trends. Occasional volume spikes may occur, suggesting final capitulation or early accumulation by savvy investors.
Market Sentiment and Trading Patterns
Investor psychology during this period is dominated by uncertainty and disbelief. Many participants question whether values will stabilize or continue declining. This creates a balance between remaining sellers and early buyers.
Trading behavior often includes false breakouts in both directions. Prices may briefly move beyond established boundaries before returning to the consolidation zone. This tests market conviction and helps identify genuine base-building.
The duration of this stage varies significantly. It can last from weeks to years depending on the severity of the preceding decline and how quickly sentiment shifts from pessimistic to neutral or cautiously optimistic.
Identifying the Accumulation Phase in Crypto Trading
Successful identification of market turning points depends on recognizing subtle shifts in trading volume and price behavior. This stage occurs when large participants begin building positions quietly.
Volume and Price Consolidation Signals
Volume analysis provides crucial insights during this period. Higher trading volume on up days versus down days suggests buying pressure is increasing.
Occasional volume spikes during temporary dips often indicate institutional activity. These patterns reveal smart money entering the market without causing major price movements.

Recognizing Tight Trading Ranges
Tight ranges form when volatility decreases significantly. The price band narrows over time as equilibrium develops between buyers and sellers.
Repeated tests of support levels without breakdowns signal strong base formation. Resistance levels remain consistent, creating a defined ceiling for the consolidation.
| Signal Type | Bullish Indicator | Bearish Warning |
|---|---|---|
| Volume Pattern | Higher volume on up moves | Higher volume on down moves |
| Price Action | Support holds on multiple tests | Support breaks easily |
| Range Behavior | Tightening volatility | Expanding volatility |
| Duration | Extended base building | Quick breakdowns |
Understanding these market phases helps traders distinguish between genuine accumulation and temporary pauses. The patterns provide early warnings of potential trend changes.
Utilizing AMD Trading Strategies in Market Consolidation
The AMD trading methodology offers a structured way to interpret complex market behavior during range-bound conditions. This framework helps traders understand institutional movements that often dictate longer-term trends.
Overview of Accumulation, Manipulation, and Distribution
The AMD approach breaks down institutional activity into three distinct stages. Each stage reveals different aspects of large participant behavior.
During the first stage, institutions build positions quietly. They use methods that avoid significant price impacts. This allows them to acquire digital assets at favorable terms.
The second stage involves deliberate price distortions. These tactics target retail trader psychology through stop hunts and false breakouts. Recognizing these patterns helps avoid emotional decisions.
The final stage occurs when institutions begin selling their holdings. This often marks the end of upward trends. Understanding this cycle provides valuable context for strategic planning.

Implementing Tools like LuxAlgo for Detection
Specialized tools automate the identification of AMD phases. LuxAlgo provides TradingView indicators that streamline this process.
The PAC Toolkit identifies zones where accumulation or distribution occurs. Signals & Overlays help distinguish genuine breakouts from false moves. The Oscillator Matrix analyzes money flow and divergences.
Proper configuration aligns these tools with specific asset characteristics. Volume thresholds and confirmation filters improve detection accuracy. This systematic approach enhances trading decisions during consolidation periods.
Technical Tools and Indicators for Informed Decisions
Technical analysis provides essential frameworks for navigating market transitions with greater confidence. These tools remove emotional bias and create systematic approaches to entry and exit timing.
Volume-price analysis represents one of the most reliable methods for confirming accumulation scenarios. Increasing volume on upward moves within the range indicates growing buying interest.

Volume-Price Analysis and Moving Averages
Moving averages help identify underlying trend direction during quiet periods. Prices consistently holding above rising averages confirm genuine base-building rather than distribution.
Resistance levels mark the upper boundary where selling pressure typically emerges. Monitoring volume as price approaches these resistance levels helps determine breakout validity.
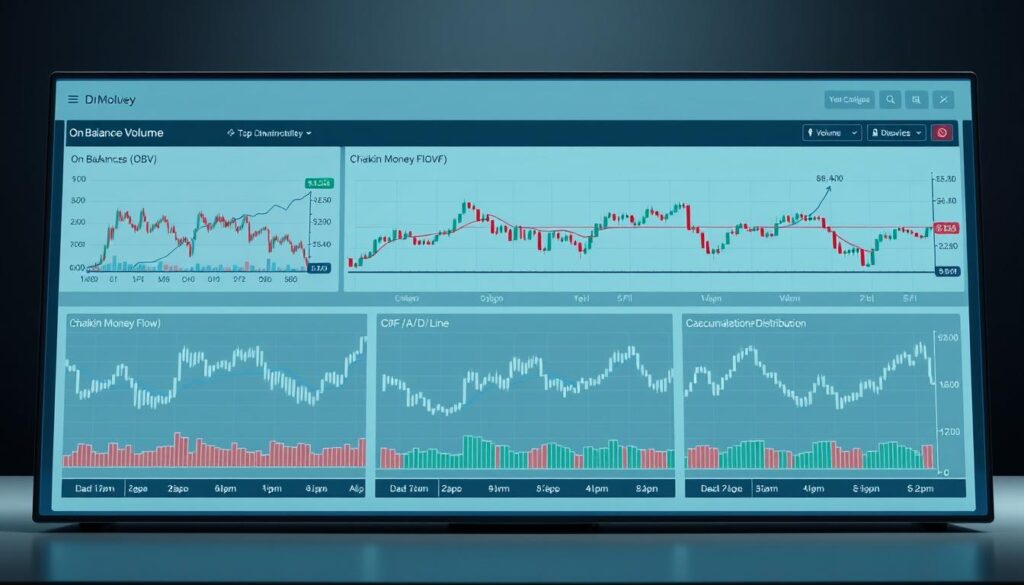
Volume indicators like OBV and VWAP specifically measure whether trends support accumulation scenarios. Chart patterns including rectangles and triangles provide visual frameworks for understanding progression.
Combining multiple technical tools creates confirmation systems where trading decisions require agreement from different indicators. This approach reduces false signals during consolidation periods.
The most effective analysis involves higher timeframe charts to identify broader market structure. Lower timeframes then provide precise entry timing within established ranges.
Strategies for Optimal Entry and Exit During Accumulation
Strategic positioning during quiet market periods requires precise timing and disciplined risk management. This stage offers significant opportunity for those who understand how to navigate its unique conditions.

Timing Entry Points with Confirmed Breakouts
Successful traders wait for genuine breakouts above the trading range. They look for increased volume to confirm the move is real.
Multi-timeframe analysis helps identify the best entry opportunities. Higher charts show the overall trend direction. Lower timeframes provide specific entry points.
Some experienced participants enter near support levels within the range. This approach offers favorable risk-reward ratios but requires tight stop-loss orders.
Setting Stop-Loss and Take-Profit Levels
Proper placement of protective orders is crucial during this phase. Stop-loss levels should sit beyond the range boundaries to avoid false triggers.
Take-profit targets can be measured using the range height. Projecting this distance upward from the breakout point gives a technical objective.
Risk management involves adjusting position sizes for wider stops. Partial profit-taking at initial targets protects gains while allowing remaining positions to run.
Patience remains essential as this period can extend for considerable time. Premature entries often result in missed opportunity or unnecessary losses.
Risk Management and Capital Allocation Considerations
Effective capital preservation strategies become essential when market direction remains unclear. This approach focuses on protecting your portfolio value during uncertain periods. Proper risk management ensures you maintain sufficient funds for future opportunities.
Managing Exposure During Volatile Phases
During manipulation periods, reduce position sizes and use wider stop-loss orders. This accommodates increased price swings without premature exits. Some brokers offer guaranteed stop-loss orders for additional protection.
Limit exposure to 1-3% of total trading capital per position. This prevents significant portfolio damage from consecutive losses. Systematic rules help resist pressure to enter prematurely.
Diversifying Strategies to Minimize Drawdowns
Spread your investment across different digital assets to reduce concentration risk. Not all consolidation patterns resolve favorably. Diversification protects against timing variations between market conditions.
Focus on risk-adjusted returns rather than absolute gains. Consistent modest profits with controlled losses outperform aggressive approaches. Combine technical analysis with fundamental research for better investment decisions.
Capital preservation remains the primary goal during these periods. Maintain discipline and patience to capitalize fully when confirmed breakouts occur.
Adapting to a Dynamic Crypto Market Environment
Successful traders recognize that one-size-fits-all strategies fail in dynamic financial ecosystems. The digital asset landscape constantly shifts between different regimes, each requiring tailored approaches.
Adjusting Strategies for Bull, Bear, and Range Conditions
During upward trends, accumulation patterns typically resolve faster. Traders can use more aggressive entry tactics with tighter protective orders. The supportive environment allows for shorter timeframes.
Bearish conditions demand greater caution. False bottoms appear frequently, requiring extended consolidation periods. Multiple technical confirmations become essential before committing capital.
Range-bound markets present the toughest challenge. The lack of clear direction means traders should focus only on the clearest setups. Marginal opportunities should be avoided entirely.
Strategy modifications include adjusting position sizes and profit targets. Larger positions work in trending conditions, while smaller allocations suit volatile periods. Extended targets make sense during bull runs.
The 24/7 nature of digital assets creates unique considerations. Without daily closes, patterns develop continuously. This requires wider stops and more active monitoring.
Sentiment tools like the Fear and Greed Index help gauge market psychology. Maximum pessimism often signals the strongest accumulation opportunities. Neutral readings suggest moderate setups.
Different assets respond uniquely to market cycles. Bitcoin correlations vary across the ecosystem. This requires customized approaches for each digital asset class.
Conclusion
The strategic advantage gained from recognizing early-stage institutional positioning cannot be overstated in volatile markets. Mastering this skill transforms abstract market theory into actionable investment strategies that capitalize on cyclical opportunities.
Throughout this guide, we’ve emphasized that disciplined risk management remains the cornerstone of successful participation. Investors who combine technical tools with fundamental assessment create systematic approaches that remove emotional decision-making.
The AMD framework provides essential structure for understanding how institutional activity shapes market dynamics. By analyzing crypto market trends through this lens, traders can align with prevailing flows for higher-probability trades.
Final advice emphasizes patience during extended periods and systematic rule-based approaches over discretionary trading. This methodology ensures participants won’t be caught off guard by market cycles while positioning advantageously for future markup phases.


No comments yet