
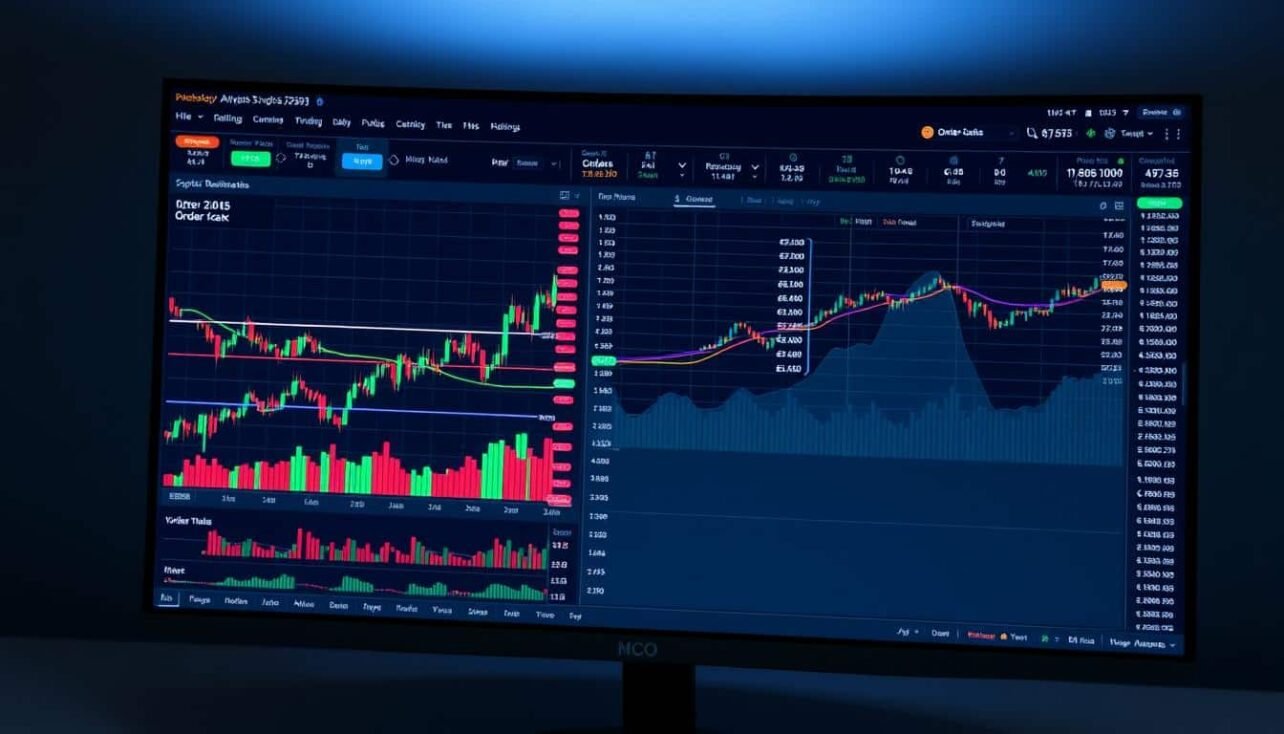
Navigating the fast-paced digital asset world requires more than just watching price charts. Successful market participants use powerful tools to see beneath the surface. One of the most vital tools is the real-time list of buy and sell intentions, known as the order book.
This digital ledger shows every pending bid and ask for a specific asset pair. It reveals what buyers are willing to pay and what sellers are asking to receive. This transparency offers a clear view of immediate supply and demand.
Understanding this data is a foundational skill. It helps you identify liquidity and spot potential price support or resistance zones. This knowledge is crucial for making informed decisions in volatile conditions. Mastering this skill can give you a significant edge.
Unlike a simple price chart, this tool provides granular, moment-by-moment insights. It shows where other participants are placing their capital. This allows you to anticipate potential price movements and find better entry and exit points. For a deeper look at market mechanics, explore our guide on analyzing crypto market trends.
Key Takeaways
- An order book is a real-time list showing all current buy and sell offers for a digital asset.
- It provides a transparent view of market supply and demand at any given moment.
- Interpreting this data helps identify liquidity levels and potential price barriers.
- This analysis offers insights that go beyond what standard price charts can show.
- Mastering this skill can lead to better timing for entering and exiting positions.
- It is a critical tool for gaining a competitive advantage in fast-moving markets.
Understanding the Fundamentals of Order Book Analysis
At the heart of every digital asset exchange lies a powerful, transparent ledger. This tool organizes pending intentions at various price levels. It creates a clear view of supply and demand.
The Role of Buy and Sell Orders
Bid prices show what buyers are willing to pay. Ask prices indicate what sellers want to receive. This distinction is fundamental for understanding market mechanics.
Different participants contribute to this landscape. Retail investors, institutional firms, and market makers all place their intentions. Their collective actions create visible supply-demand dynamics.
When a buy intention is matched, it gets filled at the ask price. A sell intention is executed at the bid price. This process is essential for how transactions are completed.
Real-Time Data and Market Transparency
The ledger updates continuously as new intentions are placed or changed. This provides immediate feedback on shifting conditions. It is a live snapshot of market sentiment.
This data is accompanied by a history of completed transactions. Together, they offer a comprehensive picture. You see both current intentions and recent activity.
This transparency allows you to see exactly where liquidity exists. It makes digital asset markets more accessible than traditional ones. You gain a clear view of the playing field.
Exploring the Components: Bids, Asks, and the Spread
The structure of market intentions reveals itself through three fundamental components that every trader should understand. These elements work together to show real-time supply and demand dynamics.

Bid and ask prices form the foundation of market activity. The highest bid represents what buyers will pay, while the lowest ask shows what sellers demand.
Decoding Bid Prices and Ask Prices
The “top of the book” refers to the best available prices. This includes the highest bid and lowest ask at any moment.
These prices indicate immediate trading opportunities. They show where transactions can occur right now.
What the Spread Tells You About Market Liquidity
The difference between bid and ask prices is called the spread. This gap reveals important information about market conditions.
A tight spread suggests high liquidity and efficient markets. Many participants are actively trading. Buyers and sellers agree on fair value.
Wide spreads indicate lower liquidity. Fewer participants create larger price gaps. This increases trading costs for everyone.
| Spread Type | Market Condition | Trading Implication | Recommended Strategy |
|---|---|---|---|
| Tight Spread | High Liquidity | Lower transaction costs | Market orders work well |
| Wide Spread | Low Liquidity | Higher implicit costs | Use limit orders |
| Moderate Spread | Average Activity | Balanced conditions | Mix of order types |
Understanding spreads helps you choose better trading pairs. It also guides your order placement strategy for optimal results.
Interpreting Market Depth and Liquidity
Market depth analysis moves beyond surface-level price data to uncover the hidden forces shaping asset valuation. This approach examines the full range of pending intentions across all price points.

True market strength reveals itself through the accumulation of volume at various valuation levels. This comprehensive view shows where significant support or resistance may form.
Identifying Liquidity Trends at Various Price Levels
Deep markets feature substantial volume distributed across multiple price points. This creates efficient price discovery and allows larger transactions with minimal impact.
Shallow markets show sparse intentions with significant gaps between levels. These conditions lead to higher volatility as even moderate-sized moves can cause dramatic price swings.
Assessing Order Imbalances for Trading Signals
Significant disparities between buy and sell intentions often signal upcoming price movements. When buyers substantially outnumber sellers at key levels, upward pressure typically follows.
The opposite imbalance suggests distribution phases and potential downward movement. Monitoring these shifts provides early warning of directional changes before they appear in price charts.
Understanding market depth and liquidity helps assess whether sufficient volume exists to support your intended transaction size without unfavorable price impact.
How order book analysis cryptocurrency trading Impacts Decision Making
Market transparency through pending buy and sell offers provides a strategic advantage in decision-making. This visibility eliminates information asymmetry, showing exactly where capital is positioned.

Traders can assess whether markets have sufficient liquidity for their intended position sizes. Markets with significant volume near current prices offer more stable environments. Thin markets show higher volatility risk.
Identifying support levels becomes straightforward by locating clusters of large buy intentions. Resistance zones appear where sell offers accumulate. This knowledge informs better stop-loss placement and profit targets.
Continuous monitoring provides immediate feedback on changing sentiment. Strategies can adjust as liquidity conditions evolve in real-time.
| Decision Factor | Without Market Depth Data | With Complete Visibility | Impact on Results |
|---|---|---|---|
| Entry Timing | Based on price charts alone | Informed by liquidity clusters | Improved execution quality |
| Position Sizing | Estimated market capacity | Precise volume assessment | Reduced price impact |
| Risk Management | Generic stop placement | Strategic level positioning | Enhanced protection |
| Exit Strategy | Price target guessing | Resistance zone targeting | Optimized profit taking |
This approach transforms how participants manage their capital. It turns speculation into calculated strategy based on visible supply and demand dynamics.
Implementing Order Book Strategies: A Step-by-Step Guide
Successful traders develop consistent habits for observing market depth data and interpreting trade history patterns. This systematic approach turns theoretical knowledge into practical advantage.
Proper implementation requires both technical setup and analytical discipline. These steps help you gain actionable insights from market data.
Setting Up Effective Order Book Tools
Choose platforms with real-time updates and clear depth visualization. Look for exchanges that provide comprehensive historical data access.
Customize your interface to highlight key information for your strategy. Different styles require different data prioritization.
Focus on platforms with fast execution speeds and reliable data feeds. This ensures you see accurate market conditions.
Monitoring Trade History for Market Sentiment
Compare pending intentions with completed transactions. This reveals the relationship between stated positions and actual activity.
Watch for discrepancies between the order book and trade execution. These patterns can indicate hidden liquidity or changing sentiment.
Track volume ratios between buy and sell sides at various levels. Systematic monitoring helps identify potential price movements early.
Develop routines for documenting patterns that precede significant market moves. Consistent observation builds valuable intuition over time.
Technical Tools for Advanced Order Book Analysis
Advanced technical platforms convert numerical trading information into graphical formats that reveal hidden market patterns. These visual tools help traders quickly interpret complex data.

Sophisticated interfaces transform raw numbers into clear pictures of market structure. This approach makes complex information more accessible.
Utilizing Depth Charts and Real-Time Feeds
Depth charts display cumulative buy and sell volume across different price points. They show two lines representing bids and asks meeting at the current market value.
These visual tools help identify significant liquidity clusters. Large concentrations appear as steep vertical sections on the chart.
Buy walls and sell walls create psychological barriers where prices often stall. Breaking through these levels requires substantial volume.
Real-time feeds provide continuous updates on changing market conditions. Traders can watch how quickly walls form or dissolve.
Combining visual charts with numerical data creates a comprehensive framework. This dual approach offers superior market insight.
Risk Management and Order Execution Strategies
Effective capital protection in digital markets requires more than just entry timing. Intelligent execution methods help preserve your funds during transactions. These strategies become crucial when dealing with volatile assets.
Slippage occurs when your fill price differs from expected levels. This difference becomes significant in markets with limited participants. Thin order books show sparse liquidity at various price points.
Minimizing Slippage in Illiquid Markets
Large transactions can consume multiple price levels in illiquid conditions. This creates unfavorable execution prices for your entire position. Checking market depth before entering helps assess potential impact.
Breaking large intentions into smaller portions reduces market disruption. This approach uses available liquidity more efficiently. It prevents your transaction from moving prices against you.
Managing Volatility with Limit Orders
Limit orders specify your exact desired execution price. They provide protection against sudden price swings. This contrasts with market orders that fill at current levels.
During high volatility, spreads between bid and ask prices widen significantly. Limit orders prevent fills at unfavorable prices. They ensure you only transact at your specified levels.
| Order Type | Best For | Slippage Risk | Execution Certainty |
|---|---|---|---|
| Market Order | Liquid assets | High in volatility | Immediate fill |
| Limit Order | All conditions | Controlled | Price certain |
| Stop-Limit Order | Breakout moves | Moderate | Conditional |
Continuous monitoring of the order book is essential throughout execution. Liquidity conditions can change rapidly in fast-moving markets. Adaptive strategies help navigate these shifting conditions successfully.
Practical Applications: From Scalping to Institutional Trading
Market participants across different timeframes find practical value in studying pending buy and sell intentions. This approach benefits both rapid-fire positions and long-term capital deployment strategies.
Scalping Techniques Using Order Book Data
Short-term participants watch for temporary compression between bid and ask prices. These moments create opportunities for quick round-trip executions.
Successful scalpers monitor the real-time ledger for fleeting supply-demand shifts. They act before these changes appear in completed transactions or price movements.
This method provides split-second timing advantages that traditional chart analysis cannot match. It turns momentary inefficiencies into profit opportunities.
Large market players examine how liquid the exchange appears before deploying capital. They study the accumulation of intentions at various valuation points.
This scrutiny reveals potential obstacles to executing significant positions. It helps institutional investors minimize market impact when entering or exiting.
Both approaches share common analytical principles despite different time horizons. Each style adapts market depth insights to its specific needs and capital size.
Integrating Order Book Data with Overall Trading Strategies
Building a complete market view requires combining multiple analytical perspectives for maximum effectiveness. The real-time ledger of buy and sell intentions works best when paired with other market insights.
This integration creates a powerful framework for decision-making. It helps validate signals across different data sources.
Combining Technical Analysis with Order Book Signals
Traditional chart patterns gain stronger confirmation when supported by corresponding depth data. Support levels identified through price action become more reliable when large buy clusters appear at the same valuation points.
Resistance zones show greater significance when substantial sell intentions accumulate there. This convergence creates high-probability trading scenarios with multiple confirming factors.
Market sentiment and external events can override short-term depth signals. Regulatory announcements or adoption trends may cause price movements that contradict current order book structures.
Develop systematic processes that incorporate depth confirmation as a final check. This approach ensures comprehensive analysis before execution.
Conclusion
Mastering the flow of pending buy and sell intentions elevates market participation from guesswork to strategic execution. This approach provides a clear window into collective psychology and liquidity conditions.
Understanding market depth transforms how investors approach digital assets. It reveals optimal entry and exit points where sufficient volume exists. This knowledge helps manage execution risk during volatile periods.
Consistent practice with these techniques builds valuable intuition over time. Start with simple observation of support and resistance levels. Gradually advance to detecting imbalances and optimizing your execution strategy.
Remember that this skill complements other analytical methods. Combined with chart patterns and market sentiment, it creates a powerful, holistic framework for navigating dynamic markets successfully.
FAQ
What is an order book in crypto markets?
An order book is a real-time list showing all pending buy and sell requests for a specific digital asset. It displays the price levels and volume traders are willing to trade at, providing a clear view of market depth and liquidity.
How can order book data help predict price movements?
By analyzing the concentration of large buy or sell orders, you can spot potential support and resistance zones. Significant imbalances often signal where the price might stall or reverse, offering valuable insights for your next trade.
What is the difference between market depth and the bid-ask spread?
Market depth refers to the volume of orders available at different price points, indicating liquidity. The bid-ask spread is the gap between the highest bid and the lowest ask; a narrow spread typically means high liquidity and lower execution risk.
Why is slippage a concern, and how can I minimize it?
Slippage happens when a market order executes at a different price than expected, common in volatile or illiquid markets. Using limit orders instead of market orders gives you control over the execution price, helping to reduce this risk.
Can order book analysis be used for short-term strategies like scalping?
Absolutely. Scalpers rely on real-time data from the order book to make quick trades. They look for large orders being placed or pulled to gauge immediate supply and demand shifts, aiming to profit from small price changes.
How do I combine order book signals with other forms of analysis?
For a robust strategy, combine order book data with technical analysis. For instance, if a chart shows a key support level and the order book reveals a large buy wall at that same price, it strengthens the signal for a potential bounce.
No comments yet