
Navigating the digital asset landscape requires understanding key metrics. One of the most crucial is the relationship between the largest cryptocurrency and the rest of the market. This guide offers a deep dive into that dynamic.
Bitcoin dominance acts as a powerful barometer for the entire crypto sector. It measures the proportion of the total market capitalization held by the original digital currency. When this metric shifts, it signals major changes in investor sentiment.
Fluctuations in this key figure reveal how capital moves between different types of assets. A rising percentage often indicates a “flight to safety” among investors. Conversely, a falling figure can signal growing appetite for risk and innovation in alternative projects.
This analysis will equip you with the knowledge to interpret these movements. We will explore historical patterns and the fundamental drivers behind them. Mastering this concept provides a significant edge in making strategic portfolio decisions.
Key Takeaways
- Bitcoin dominance measures Bitcoin’s share of the total cryptocurrency market value.
- It is a vital indicator of overall market sentiment and capital flow trends.
- Understanding its cycles helps identify potential entry and exit points for various digital assets.
- The metric fluctuates based on investor confidence, news, and economic conditions.
- This analysis provides a framework for using this data in your investment strategy.
Market Overview: The Rise of Bitcoin Dominance
The digital asset ecosystem constantly shifts, with one metric serving as a primary gauge for these changes. This key figure is known as bitcoin dominance.
It is calculated by dividing the market cap of the original cryptocurrency by the total value of the entire cryptocurrency market. This simple formula reveals the leading asset’s share of the overall space.
Historically, this percentage has swung dramatically. It can soar above 70% during fearful periods. This shows a “flight to safety” as capital consolidates into the most established project.
Conversely, the figure often plummets below 40% during times of intense speculation. This signals a “risk-on” environment where money flows into newer, more experimental assets. For a deeper bitcoin vs altcoin dominance analysis, understanding these cycles is essential.
| Market Condition | Typical BTC Dominance Level | Investor Sentiment |
|---|---|---|
| Bear Market / High Uncertainty | Above 60% | Risk-Off (Seeking Safety) |
| Bull Market / Altcoin Season | Below 45% | Risk-On (Seeking Growth) |
| Transitional Period | 45% – 60% | Neutral / Cautious |
Monitoring btc dominance provides real-time insight into capital rotation. A rising percentage suggests caution, while a falling one indicates growing appetite for risk across the crypto market.
Understanding bitcoin dominance impact on altcoins
The dance between the largest cryptocurrency and its smaller counterparts creates predictable market rhythms. This relationship forms one of the most reliable patterns in digital asset trading.
When investors seek safety during uncertain times, capital flows toward established assets. This movement creates pressure on alternative projects as money consolidates into more proven options.
Conversely, declining metrics signal growing confidence in risk-taking. Money then rotates toward innovative projects offering higher growth potential. This phase often marks the beginning of what traders call “altcoin season.”
These shifts create distinct market phases that savvy investors can identify. Bitcoin-led rallies see the pioneer outperforming. Consolidation periods show mixed performance across the board.
Understanding these cycles provides strategic advantages for portfolio management. Historical data shows that significant metric changes often precede major market turning points. This makes monitoring these patterns essential for timing decisions.
Deep Dive into Cryptocurrency Market Capitalization
To truly grasp cryptocurrency dynamics, investors must first master the concept of total market value and its implications. This foundational metric reveals the scale of capital flowing through digital assets.
Total Crypto Market Trends and Insights
The total crypto market capitalization represents the combined value of all digital currencies. This aggregate figure serves as the basis for calculating various metrics, including the important dominance percentage.
Market cap expansion indicates growing mainstream adoption and capital inflows. Different valuation tiers create distinct investment environments. For example, an $8 trillion total market creates different conditions than a $16 trillion scenario.
Understanding Market Cap vs. Price Movements
Many investors focus solely on price changes, but market capitalization provides crucial context. A token’s price can rise while its market share decreases if the overall crypto market grows faster.
This distinction helps investors understand relative strength. Monitoring both metrics offers a complete picture of capital allocation patterns across the digital asset space.
Scenario analysis based on different total market cap levels demonstrates how liquidity expansion affects valuation environments. Higher market cap tiers often correlate with increased risk appetite among investors.
Analyzing Market Trends and Investor Sentiment
Investor confidence levels create distinct patterns that can be observed through various market indicators. These patterns reveal whether participants are accumulating or distributing assets.

Market psychology drives capital rotation between different asset classes. Understanding these emotional shifts helps anticipate future price movements.
Sentiment Indicators in Crypto Markets
Several tools help gauge the emotional state of market participants. The fear and greed index measures current sentiment levels.
Social media activity and trading volume patterns provide additional context. These metrics combined offer a comprehensive view of market psychology.
Comparing Bitcoin and Altcoin Behavior
Different assets exhibit unique characteristics during various market phases. The pioneer cryptocurrency often leads recovery cycles.
Alternative projects typically follow with a lag before potentially outperforming. This sequential pattern creates strategic opportunities for timing investments.
| Market Phase | Investor Positioning | Typical Asset Behavior |
|---|---|---|
| Risk-Off Environment | Defensive accumulation | Established assets outperform |
| Risk-On Environment | Aggressive distribution | Innovative projects lead growth |
| Transition Period | Cautious monitoring | Mixed performance across sectors |
These behavioral patterns help investors make informed decisions. Recognizing the current phase allows for better portfolio positioning.
Historical Market Dynamics and Altcoin Cycles
History provides powerful lessons for cryptocurrency investors studying market cycles. Past performance patterns reveal how capital rotates between different digital assets. These historical market dynamics help predict future movements.
Lessons from Past Bull and Bear Markets
Market cycles follow predictable rhythms. During bull markets, investor enthusiasm drives prices upward. Bear markets see caution and price corrections.
The 2017 cycle showed classic patterns. The pioneer cryptocurrency rallied first, reaching peak dominance. Then capital flooded into alternative projects.
This rotation created massive gains for smaller digital assets. Many saw returns exceeding 10 times their initial value. The pattern repeated in 2021 with similar results.
| Market Cycle | BTC Dominance Trend | Altcoin Performance |
|---|---|---|
| 2017 Bull Run | Fell from 85% to 35% | Extraordinary gains (10x-100x) |
| 2018-2019 Bear | Rose above 70% | Significant declines |
| 2021 Cycle | Declined then recovered | Strong mid-cycle performance |
Case Examples from 2017 and 2021
The 2017 period demonstrated clear capital rotation. After initial gains, money flowed toward riskier assets. This created what traders call “altcoin season.”
In 2021, similar patterns emerged with new narratives. DeFi and NFT projects drove excitement. Understanding these cycles helps investors position strategically.
Historical analysis shows that successful investors recognize cycle phases. They adjust strategies based on current market conditions and historical patterns.
Factors Influencing Bitcoin Dominance
The landscape of digital assets is shaped by several powerful forces that determine capital allocation patterns. These elements work together to influence how money flows between different types of cryptocurrencies.

Multiple factors create complex interactions between regulatory developments and macroeconomic conditions. Technological innovation and market psychology also play crucial roles in this dynamic environment.
Regulatory, Economic, and Global Drivers
Government policies significantly affect the cryptocurrency space. When regulators focus primarily on established assets, the dominance metric often rises. Favorable treatment for alternative projects can cause this figure to fall.
Economic conditions including inflation rates and interest policies determine overall risk appetite. Tightening financial conditions generally favor more stable assets over speculative alternatives.
Global regulatory shifts across major jurisdictions create asymmetric impacts. United States SEC actions, European MiCA regulations, and Asian policies affect different assets based on compliance complexity.
Market conditions such as volatility levels and institutional participation influence investor behavior. These elements determine whether capital consolidates into established options or diversifies across newer projects.
Technological developments and innovation cycles also affect the balance. Breakthroughs in decentralized finance or scaling solutions can drive changes in capital distribution patterns.
Altcoin Season: When and Why It Occurs
When alternative cryptocurrencies dramatically outperform the market leader, investors witness a phenomenon known as altcoin season. This distinct phase represents one of the most exciting periods in digital asset investing.
These explosive periods typically emerge after strong Bitcoin rallies stabilize. The timing often correlates with bitcoin dominance falling below critical thresholds around 50%. This signals a shift in capital allocation patterns.
Capital rotation mechanics drive these seasonal surges. Early investors in the leading cryptocurrency often take profits and seek higher returns elsewhere. They move funds into smaller projects with greater growth potential.
The cryptocurrency market experiences predictable sector rotation during these periods. Money typically flows first into established alternatives, then mid-cap assets, and finally speculative projects. This creates a self-reinforcing cycle of gains.
Understanding these dynamics helps investors make strategic portfolio adjustments. Monitoring key metrics provides early warning signals for optimal entry and exit timing during these profitable market phases.
Impact of Regulatory and Economic Factors
Government policies and economic conditions create powerful forces that reshape cryptocurrency allocation patterns. These external elements often override pure technical analysis in determining capital flows.
Regulatory developments exert profound influence by determining which digital assets institutions can access. Clear frameworks for established cryptocurrencies typically support higher market share percentages.
Global Regulatory Shifts
Different jurisdictions approach cryptocurrency regulation with varying philosophies. Some countries provide clear guidelines for major digital assets while leaving others in legal uncertainty.
This creates asymmetric impacts on capital distribution. Institutional money tends to flow toward assets with established regulatory clarity. The resulting conditions favor more recognized projects during uncertain periods.
US Market Specific Influences
The United States regulatory environment significantly affects global cryptocurrency trends. SEC decisions and court rulings create immediate market reactions.
ETF approvals and securities classifications determine mainstream investment access. These factors directly influence which assets receive institutional capital inflows.
| Factor Type | Specific Influence | Market Response |
|---|---|---|
| Regulatory Clarity | Increases institutional participation | Capital consolidation into established assets |
| Economic Uncertainty | Rises during inflation concerns | Flight to perceived safer options |
| Interest Rate Changes | Affects risk appetite levels | Rotation between asset classes |
Economic conditions like Federal Reserve policies create broader market environments. Higher interest rates typically reduce speculation across the cryptocurrency sector.
Understanding these regulatory and economic factors helps investors anticipate significant shifts. This knowledge provides strategic advantages in portfolio positioning.
Strategic Insights for Investors
Smart portfolio management in the cryptocurrency space requires more than just tracking prices. Astute investors use key metrics as a framework for their investment strategy. This approach helps answer critical questions about asset allocation and timing.
One powerful method involves setting specific thresholds for rebalancing. When the leading asset’s market share rises above 60%, it often signals a time for defensive positioning. Conversely, a drop below 45% may indicate an opportunity to accumulate selective alternatives.
This metric helps with crucial decisions about profit-taking and risk exposure. Should you rotate gains from smaller projects back into the established leader? Is it time to increase allocation to innovative assets? The data provides context for these strategic moves.
Contrarian positioning can sometimes yield superior returns. This means buying alternatives when the metric peaks and favoring the pioneer when it bottoms. While uncomfortable short-term, this approach recognizes the cyclical nature of the crypto landscape.
Ultimately, successful portfolio management combines this broad metric with deep fundamental research. A dynamic strategy that adapts to changing conditions often outperforms static approaches. Understanding these patterns helps investors maintain conviction during different market phases.
Technical Overview: Chart Analysis and Metrics
Technical chart examination provides crucial insights into market structure and capital flow patterns. Visual representations transform complex data into clear signals for strategic decision-making.

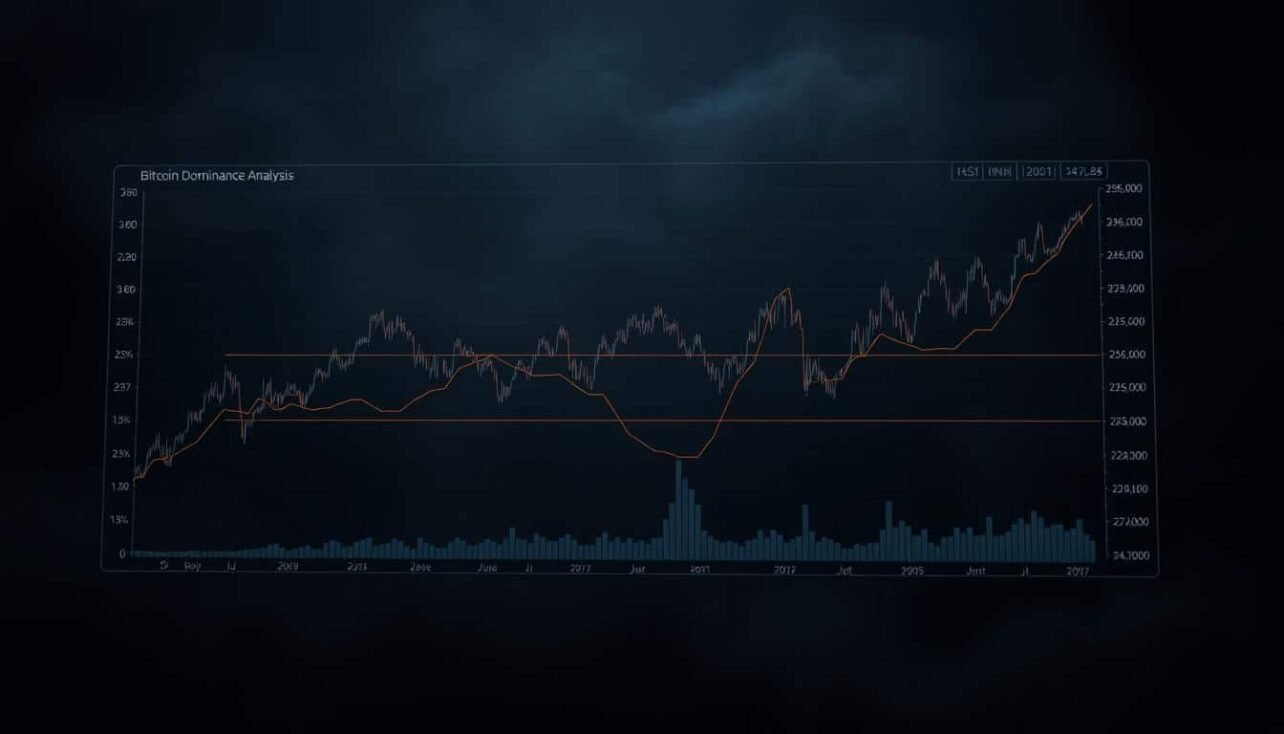
Interpreting the Bitcoin Dominance Chart
The bitcoin dominance chart displays percentage changes over time. Rising lines indicate capital consolidation into established assets.
Falling trends signal rotation toward alternative projects. This visual analysis helps identify market phase transitions.
Key Metrics and Data Points to Watch
Several technical indicators enhance chart interpretation. Moving averages reveal trend direction and strength.
Support and resistance levels mark critical turning points. Volume confirmation validates breakout signals.
| Technical Tool | Primary Function | Trading Signal |
|---|---|---|
| 50-Day Moving Average | Trend Direction | Above/Below Line |
| RSI Momentum | Overbought/Oversold | Extreme Readings |
| Volume Analysis | Confirmation | Breakout Validation |
| Support/Resistance | Key Levels | Bounce/Break Points |
Utilizing Technical Tools for Market Analysis
Combining multiple metrics creates robust trading strategies. Different timeframes offer varied perspectives.
Daily charts suit short-term positioning. Weekly views support swing trading decisions. This multi-timeframe approach provides comprehensive market insight.
Case Studies and Comparative Analysis
Real-world examples from previous bull and bear markets offer practical lessons for today’s investors. Historical case studies reveal how capital rotates between different digital assets during various market phases.
The 2017 bull run provides a classic example of market dynamics. The leading cryptocurrency’s share dropped from 85% to 35% as alternative projects experienced explosive growth. Many tokens delivered returns exceeding 10 times their initial value.
A comparative analysis between 2017 and 2021 shows similar patterns with different catalysts. The earlier cycle featured ICO speculation, while 2021 saw DeFi protocols and NFT projects driving enthusiasm.
Performance data reveals distinct patterns during these cycles. The pioneer cryptocurrency often leads initial recoveries before capital rotates toward innovative alternatives. This creates asymmetric opportunities for strategic positioning.
These historical case examples serve as practical templates for recognizing current market conditions. Understanding past performance patterns helps investors anticipate probable next phases in the cryptocurrency landscape.
Actionable Trading Strategies and Portfolio Adjustments
Effective portfolio management moves beyond theoretical understanding to actionable implementation strategies. Converting market insights into profitable decisions requires systematic approaches.

Practical methods help investors navigate changing conditions. These approaches balance short-term opportunities with long-term objectives.
Short-Term Trading Tactics
Active traders use momentum signals for timing entries. When key levels break with volume confirmation, position adjustments become necessary.
Rate-of-change indicators identify trend acceleration early. This allows positions before broader market recognition. Divergence analysis reveals underlying strength shifts.
Quality assets often show strength during market rotations. Selective accumulation ahead of major moves can capture significant gains.
Long-Term Investment Strategies
Strategic allocation maintains core positions while adjusting exposure. Base holdings provide stability during volatility.
Threshold-based rebalancing offers disciplined framework. Gradual adjustments through defined ranges reduce timing risks.
Combining metric analysis with fundamental research creates robust approach. This two-layer strategy determines both allocation and selection.
Risk management includes position sizing adjustments. Lower leverage during uncertainty protects capital. Flexibility across market phases captures cyclical returns.
Conclusion
The balance of power within the cryptocurrency space offers profound insights for strategic positioning. This analysis has demonstrated how a key metric serves as both a sentiment gauge and allocation framework.
Investors who understand these patterns gain significant advantages in timing decisions. They can better navigate the cyclical nature of capital rotation between different digital asset classes.
Successful investment approaches combine this metric with broader research. This creates robust portfolio strategies that adapt to changing market conditions.
As the crypto landscape evolves, monitoring these dynamics remains essential. The principles of capital flow between established and emerging assets will continue providing valuable guidance.
FAQ
What is the relationship between the total crypto market cap and BTC dominance?
The total market capitalization represents the combined value of all digital assets. Bitcoin’s share of this total is its dominance. When this metric increases, it often means capital is flowing into Bitcoin faster than into other tokens, which can pressure altcoin prices.
How can I use the dominance chart to inform my investment strategy?
Monitoring the Bitcoin dominance chart helps gauge overall market sentiment. A rising chart suggests a risk-off environment where investors favor the perceived safety of Bitcoin. A declining chart can signal an “altcoin season,” where investors seek higher returns from smaller-cap assets, guiding portfolio adjustments.
What are the key factors that cause shifts in market dynamics between Bitcoin and altcoins?
Major drivers include macroeconomic conditions, regulatory news, and technological developments. Positive regulatory clarity for Bitcoin or negative news for altcoins can boost its share. Conversely, breakthroughs in altcoin projects or a strong bull market can reduce Bitcoin’s portion of the total crypto market cap.
How does investor sentiment affect the performance of different cryptocurrencies?
Market sentiment is a powerful force. Fear or uncertainty often drives capital toward established assets like Bitcoin, increasing its dominance. In periods of greed and optimism, investors are more likely to diversify into altcoins, betting on their higher growth potential, which can lead to a falling dominance metric.
What historical trends should I know about regarding crypto market cycles?
Historical data shows that bull markets often begin with Bitcoin leading the charge, causing its dominance to rise. As the bull run matures, capital typically rotates into altcoins, leading to a decline in Bitcoin’s market share. Recognizing these cycles can help with timing investment decisions.
What technical tools and metrics are essential for analyzing these market conditions?
Beyond the dominance chart, key metrics to watch include trading volume, relative strength indicators for major tokens, and the performance of the total crypto market capitalization. These data points provide a fuller picture of whether the market is in an accumulation or distribution phase.
No comments yet