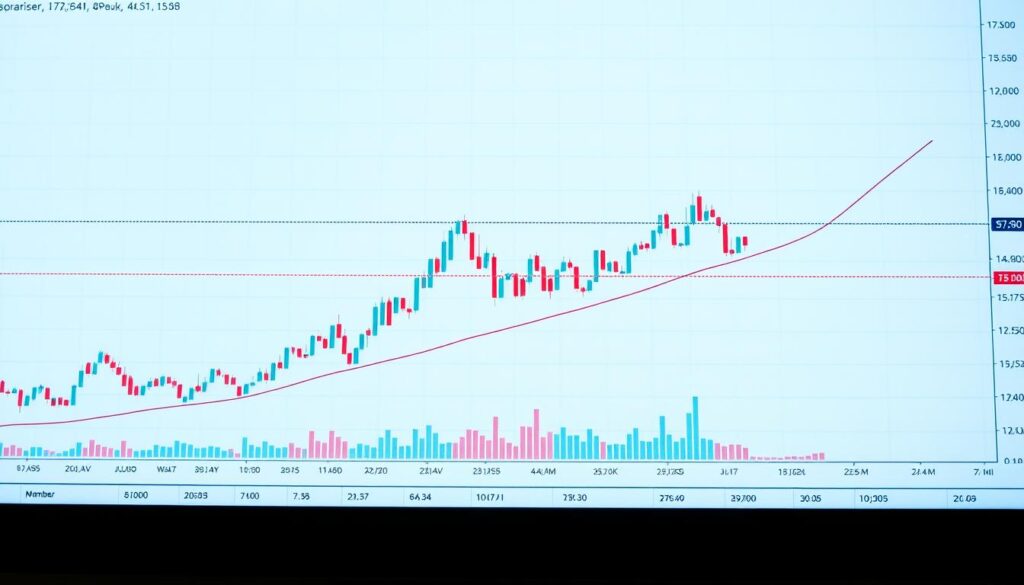
Navigating cryptocurrency downturns requires keen observation and strategic thinking. This guide explores how to recognize when digital assets may be reaching their lowest points during challenging periods.
Identifying potential turning points helps investors make informed decisions. Understanding these patterns is crucial for managing risk and developing effective investment strategies.
The cryptocurrency space offers various tools for analysis. Technical indicators and sentiment metrics provide valuable insights into market behavior.
This comprehensive approach combines multiple data sources. Historical patterns, on-chain metrics, and psychological factors all contribute to a complete picture.
Both new and experienced traders will find practical frameworks here. Learning to spot accumulation opportunities can significantly improve long-term results in volatile conditions.
By studying these methods, you’ll gain confidence in timing your market entries. No single indicator guarantees perfect foresight, but combining signals increases accuracy substantially.
Introduction to Bitcoin Bear Markets
Digital asset valuations move through distinct phases of expansion and contraction that form predictable rhythms. These alternating periods create opportunities for strategic positioning when understood properly.
Setting the Context for Bear and Bull Cycles
The cryptocurrency ecosystem operates in highly cyclical patterns. Since 2013, major price declines of 70% or greater have occurred approximately every 2.1 years.
These downtrends typically last around 9 months on average. Some contractions complete in just 4-5 months, while extended periods may continue for 12-13 months.
Following significant declines, recovery phases historically average 12 months in duration. Some bull runs extend up to three years, while others conclude more quickly.
Understanding the Significance of Market Bottoms
Price lows represent critical inflection points where selling pressure exhausts itself. This is when accumulation by informed participants often begins.
Historical data reveals substantial gains following these inflection points. The median rally after major declines exceeds 1,600%, with some cycles delivering returns above 12,000%.
Understanding these patterns helps investors contextualize current conditions. This knowledge supports informed decision-making rather than emotional reactions to volatility.
Understanding Bear market Bitcoin bottom signals
The transition from sustained price erosion to potential recovery involves distinct market dynamics. Recognizing these patterns helps investors identify accumulation opportunities during challenging periods.
What Constitutes a Bottom in a Bear Market?
A market bottom occurs when an asset’s decline stops and stabilization begins. This inflection point marks where selling pressure exhausts itself.
Buyers gradually reassert control, shifting the supply-demand balance. The process typically involves multiple phases rather than a single event.
First comes sharp capitulation with panic selling. Then stabilization follows as weak hands exit positions. Finally, accumulation begins by informed participants.
Patterns vary between rapid V-shaped recoveries and prolonged U-shaped formations. Both represent legitimate reversal points despite different timeframes.
The Role of Technical and Sentiment Indicators
Multiple indicator categories work together to identify potential turning points. Technical tools measure price momentum and trend strength objectively.
Sentiment gauges track investor psychology extremes that often precede major reversals. These indicators reveal when pessimism reaches maximum levels.
The most effective approach combines both technical and sentiment analysis. This framework increases timing accuracy while managing inherent uncertainty.
Key characteristics include exhaustion of selling pressure and structural shifts in price action. On-chain data provides additional confirmation through participant behavior changes.
Key Technical Indicators and Tools
Technical analysis provides essential tools for identifying potential trend changes in volatile markets. These quantitative measures help traders spot accumulation opportunities during challenging periods.
200-Day Simple Moving Average and Trend Reversal
The 200-day Simple Moving Average (SMA) serves as a critical benchmark for professional traders. When an asset’s price decisively closes above this level, it often indicates a significant shift.
Sustained trading above the 200-day SMA strengthens the reversal signal over time. This moving average helps distinguish genuine trend changes from temporary rallies.
RSI Oscillator and Oversold Conditions
The Relative Strength Index (RSI) measures buying and selling pressure momentum. Readings below 30 suggest oversold conditions where downward pressure may be exhausting.
RSI signals gain reliability on longer timeframes. A weekly break above the 50 level provides conservative confirmation of momentum shifts.

| Indicator | Primary Function | Key Signal | Timeframe Strength |
|---|---|---|---|
| 200-Day SMA | Trend identification | Price close above average | Daily charts |
| RSI Oscillator | Momentum measurement | Oversold below 30 | Weekly charts |
| 48-Period SMA | Cycle tracking | Break and reclaim | Monthly charts |
Combining multiple indicators creates stronger confirmation signals. This approach reduces false readings and improves timing accuracy for strategic positioning.
Market Psychology: Fear, Capitulation, and Investor Behavior
The emotional landscape of a crypto downturn is a critical determinant of its eventual turning point. Periods of maximum pessimism create the conditions where prices can stabilize.
Widespread capitulation and heavy liquidations often signal the final phase of a major decline.

Emotional Patterns During Extreme Volatility
Investors facing substantial losses often make emotional decisions. This selling pressure typically exhausts itself during sharp capitulation events.
Emotional patterns follow a predictable path. Initial denial gives way to fear, then panic, and finally exhaustion.
This environment of extreme fear paradoxically creates the best opportunities. Disciplined participants can acquire assets at significant discounts.
How Investor Behavior Influences Bottom Formation
Panic selling by overwhelmed investors marks critical psychological lows. This behavior transfers ownership from weak hands to stronger, long-term holders.
On-chain metrics confirm these behavioral shifts. A reduction in exchange reserves and low transaction volumes are positive signals.
Understanding these dynamics allows rational investors to act contrarian to prevailing sentiment. Periods of maximum fear historically precede the strongest rallies.
Historical Perspectives on Bitcoin Bear Markets
Studying previous downturns offers valuable lessons about the cyclical nature of digital assets. Each major decline has unique catalysts but shares common recovery traits.

This analysis examines key inflection points from 2015 onward. Understanding these patterns helps contextualize current market conditions.
Analyzing Past Bear Market Bottoms from 2015 to 2023
The 2015 period followed an 83% price drop. It culminated in an extraordinary 12,804% rally, the largest on record.
Another significant decline occurred in 2018, falling 84%. This was followed by a solid 345% upward movement.
The March 2020 event saw a sharp 72% drop. Unprecedented global stimulus helped fuel a powerful 1,692% recovery.
Following the late 2021 peak, a 78% decline led to a November 2022 low. The subsequent uptrend has produced a 704% rally so far.
Statistical Insights and Rally Metrics
Data since 2013 reveals a consistent pattern. Severe downturns of 70% or more happen roughly every 2.1 years.
These challenging periods typically last about 9 months on average. The recovery phase that follows often extends for approximately 12 months.
The potential reward after such a decline is substantial. The median rally amount following a major drop is 1,692%.
The average rally across all these events is an impressive 3,485%. This demonstrates the asymmetric risk-reward profile available to disciplined investors.
| Event Year | Decline Magnitude | Subsequent Rally | Notable Context |
|---|---|---|---|
| 2015 | 83% | 12,804% | Long accumulation phase |
| 2018 | 84% | 345% | Post-peak correction |
| 2020 | 72% | 1,692% | COVID-19 crash |
| 2022 | 78% | 704% (ongoing) | Post all-time high |
This historical context is crucial for developing a robust crypto bear market strategy. Past performance does not guarantee future results, but it provides a essential framework.
Price Action and Cycle Analysis in the Crypto Market
Analyzing price movements across cycles reveals statistical patterns that guide strategic positioning. Historical data shows consistent behavior during recovery phases despite surface-level volatility.

This framework helps traders identify optimal entry points and manage expectations. Understanding typical rally and pullback magnitudes creates realistic trading plans.
Technical Patterns and Momentum Shifts
Price action during uptrends follows predictable rhythms. Even strong rallies experience regular 20%+ declines approximately every couple months.
The acceleration phase typically emerges 5-6 months after major lows. This critical transition requires at least 80-100% gains without significant pullbacks.
| Cycle Period | Average Pullback | Average Rally | Number of Events |
|---|---|---|---|
| 2015-2017 | 31% | 94% | 17 pullbacks, 18 rallies |
| 2020-2021 | 24% | 91% | 7 pullbacks, 8 rallies |
| 2022-Present | 25% | 65% | 8 pullbacks, 9 rallies |
On-Chain Metrics and Macro Influences
Blockchain data provides crucial confirmation of technical signals. Declining dormancy metrics and exchange outflows indicate long-term conviction.
Macroeconomic factors significantly impact cycle timing. Dovish monetary policies often support recovery phases by improving liquidity conditions.
Integrated analysis combining these elements offers the highest-probability signals. This comprehensive approach helps identify genuine trend changes.
Conclusion
Developing proficiency in recognizing accumulation opportunities during challenging market phases requires comprehensive methodology. The analytical frameworks discussed provide valuable tools for this purpose.
Effective risk management remains essential regardless of apparent signals. No approach guarantees perfect timing, and statistical patterns serve to enhance personal strategies rather than predict outcomes.
This article offers educational content to support informed decision-making. Always consult financial professionals and conduct thorough due diligence before making investment choices.


No comments yet