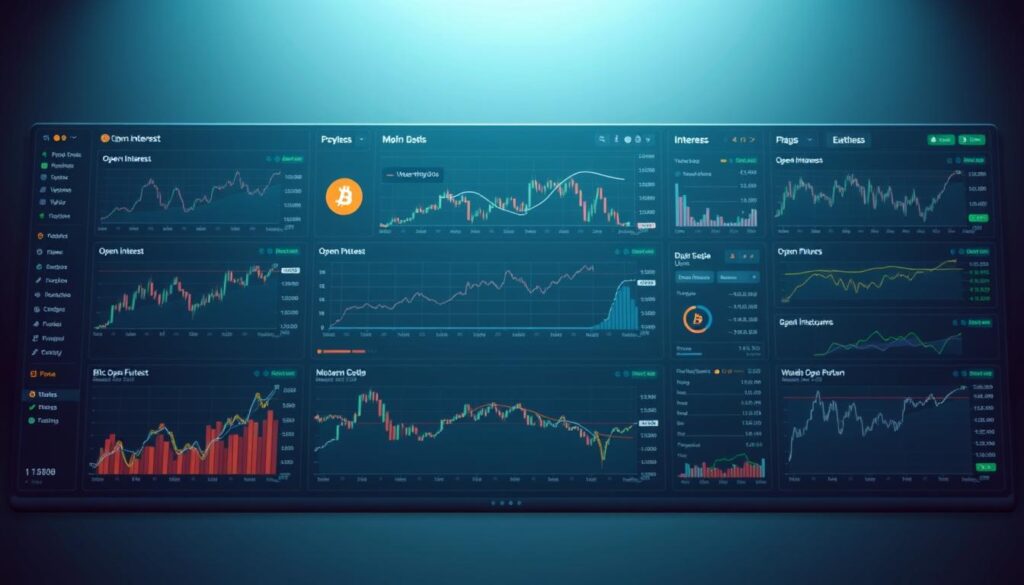
Understanding market dynamics requires looking beyond simple price charts. One powerful metric that has gained significant attention tracks the total number of outstanding derivative contracts. This measurement provides a window into trader sentiment and capital flow.
Derivative contracts allow participants to speculate on future price movements without owning the actual asset. This creates a parallel marketplace that often influences spot prices. The activity in these markets reveals valuable information about broader trends.
The concept of open interest measures all unsettled contracts at any given time. When this number rises, it indicates fresh capital entering the space. A decline suggests positions are being closed, meaning money might be exiting.
This type of analysis has become essential for anyone involved in crypto derivatives trading. It helps identify periods of accumulation or distribution. Recognizing these patterns can signal potential trend changes before they become obvious on price charts alone.
By examining historical data alongside current conditions, traders gain deeper insights into market psychology. This comprehensive approach supports more informed decision-making and better risk management strategies in the volatile digital asset space.
Market Trends and Data Overview
The digital asset landscape has transformed dramatically over the past decade. This evolution is clearly reflected in the extraordinary price appreciation seen since 2013. During a period where global liquidity doubled, the value of the leading crypto asset surged by more than 700 times.
Historical Price Movements and Volatility
This journey has been characterized by significant volatility. Sharp price swings, often exceeding 20%, are common during cycles of high leverage. These movements are closely tied to shifts in overall market sentiment.
Data shows a clear pattern. Periods of monetary expansion in major global markets often correlate with strong appreciation in crypto prices. The asset’s sensitivity to these macroeconomic changes is a key feature of its behavior.
Recent Shifts in Trading Activity
More recently, price action entered a consolidation phase. The asset traded between $108,000 and $125,000, with the lower level acting as a critical support zone. This stability attracted significant institutional accumulation.
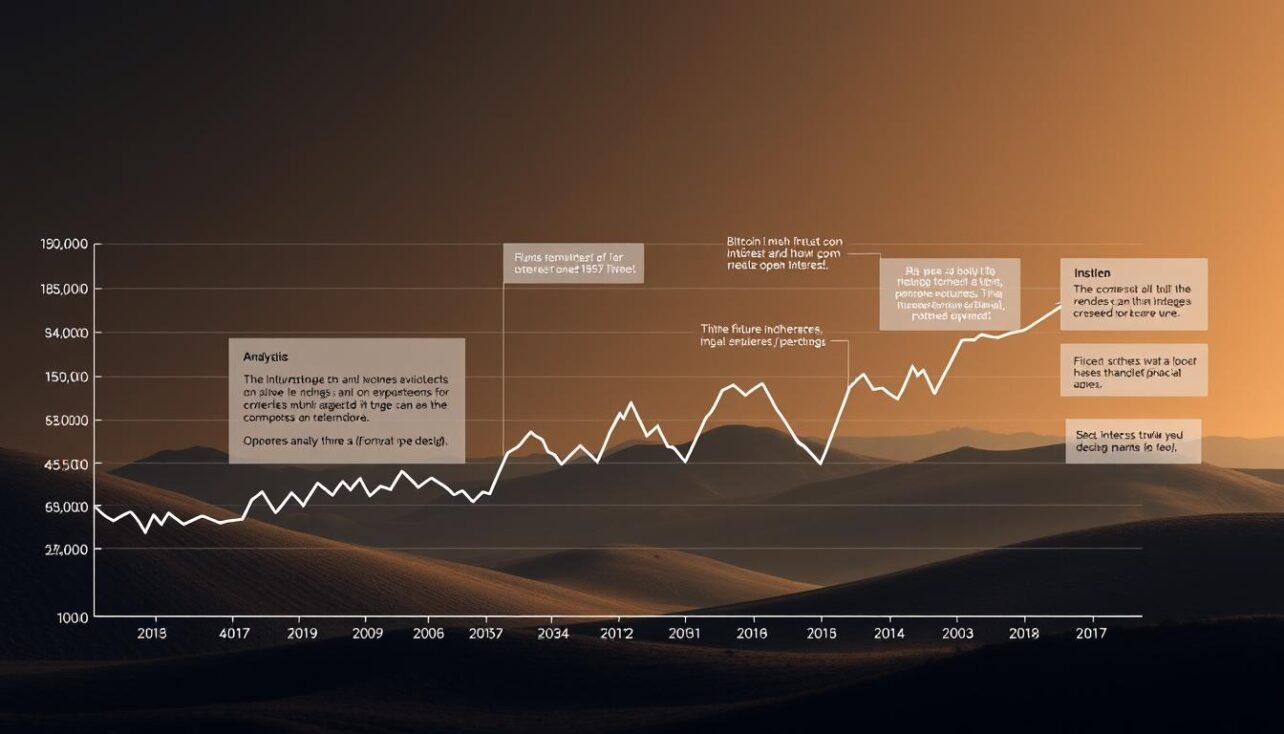
Trading activity reached a peak in early October 2025. The total value of outstanding derivative contracts hit a record $52 billion. However, an 8-hour price drawdown of 20% triggered a rapid deleveraging event.
This caused the metric to fall sharply to $39 billion. Such events highlight how extreme levels of leverage can amplify market movements. For the latest market updates, this relationship is crucial to monitor.
| Time Period | Price Range | Notable Market Activity |
|---|---|---|
| Since 2013 | 700x+ Increase | Correlation with global liquidity expansion |
| Early Oct 2025 | $108,000 – $125,000 | Consolidation and institutional accumulation |
| Oct 6, 2025 | Peak | Record open interest of $52 billion |
| Oct 10, 2025 | 20% Drawdown | Open interest fell to $39 billion |
Exploring Bitcoin futures analysis open interest
Advanced analytical tools have transformed how traders interpret market participation and capital flows. These resources provide deeper insights into where money moves and why.
Understanding Open Interest Metrics and Their Impact
Metrics tracking outstanding contracts reveal where positions concentrate across price levels. The CME Group’s Options Heatmap Tool visualizes this distribution clearly.
This tool shows concentration by strike price and expiration date. Traders can identify potential support and resistance zones.

Correlation with Global Liquidity and Price Variance
Research shows a strong relationship between contract levels and price movements. VanEck found that nearly 73% of price variance since 2020 links to futures activity.
The digital asset also correlates with global money supply growth. Changes in fiat currency liquidity explain meaningful long-term returns.
By early October 2025, leverage approached historical extremes. Cash collateral reached record highs near $145 billion.
This demonstrates substantial institutional capital entering regulated markets. High leverage levels often precede significant price adjustments.
Regulated Trading Venues and Institutional Influence
The landscape for digital asset speculation has undergone a profound shift toward regulated marketplaces. This move reflects the growing involvement of professional entities with strict compliance needs.
These participants seek the legal certainty and robust infrastructure that established financial hubs provide. This trend has significantly altered the dynamics of the entire digital asset ecosystem.
The Role of CME Group and Derivatives Markets
CME Group stands as the world’s leading derivatives marketplace. Its platform offers standardized futures and options products for the digital asset class.
These contracts have become a crucial benchmark for price discovery. They allow large traders to establish substantial positions within a familiar regulatory framework.

The concentration of activity on this exchange makes it highly influential. Its data often serves as a proxy for institutional sentiment toward the cryptocurrency.
Increased Participation from Institutions and ETF Market Makers
Institutional traders now dominate activity in these markets. Their long-term horizons and large positions contribute to reduced volatility.
A key driver is the participation of ETF market makers. These entities use bitcoin futures contracts to hedge their exposures related to spot ETF products.
This sophisticated trading activity, as noted in a study on financial innovation, introduces new stability. The overall market character has matured as a result.
| Feature | Regulated Exchange (e.g., CME) | Less Regulated Venues |
|---|---|---|
| Legal Certainty | High | Variable |
| Counterparty Risk | Low (Central Clearing) | Higher |
| Participant Profile | Primarily Institutional | Mixed (Retail/Institutional) |
| Product Standardization | High | Low |
Conclusion
Professional market participants rely heavily on derivatives metrics for strategic decisions. Tracking capital flows through these instruments provides critical insights into broader market sentiment and potential turning points.
The maturation of cryptocurrency markets has been significantly influenced by institutional involvement. Regulated venues now offer sophisticated trading products that attract substantial capital, altering traditional volatility patterns.
For any serious investor, understanding derivatives data is no longer optional. This information helps gauge conviction behind price movements and supports better risk management. The relationship between global liquidity and asset prices adds essential context for long-term allocation strategies.
As markets evolve, monitoring derivatives activity remains fundamental to navigating the digital asset space effectively.


No comments yet