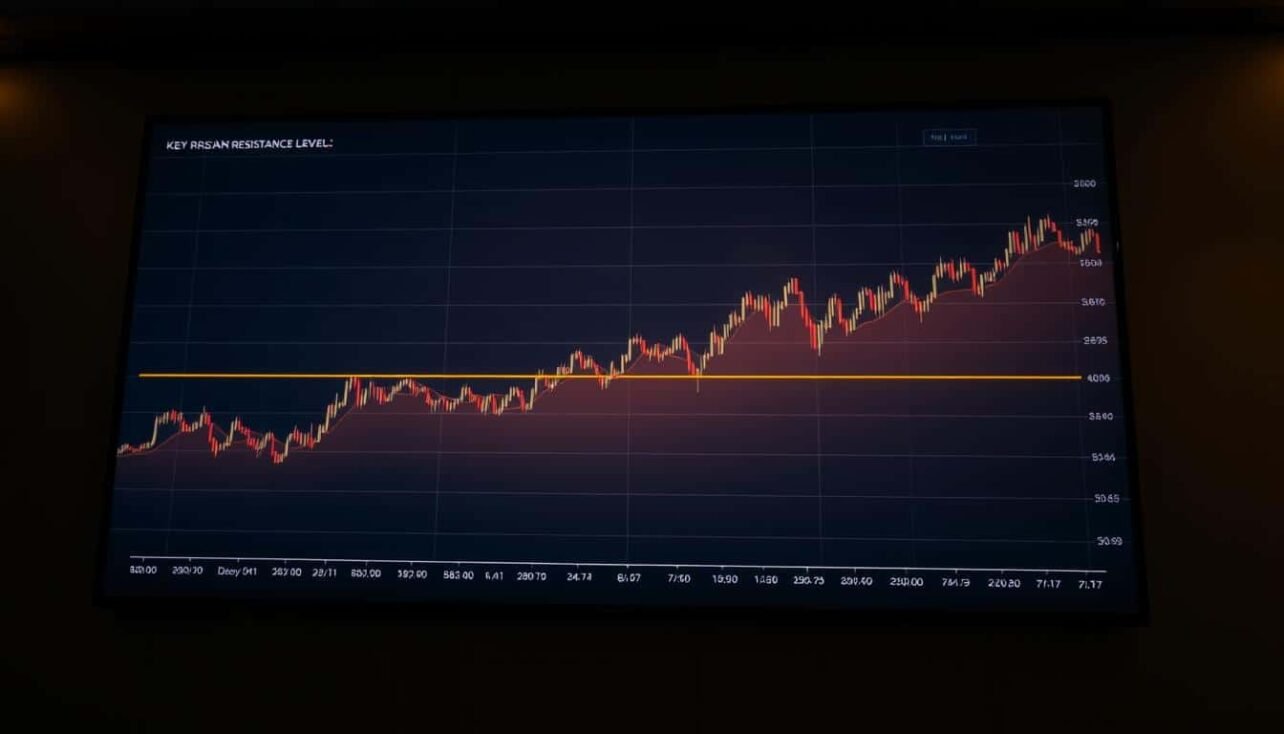
The digital asset market is watching closely as a major cryptocurrency approaches a critical juncture. The current price action is stabilizing near a significant threshold, setting the stage for a pivotal move.
After recent swings, the bitcoin price has found a footing. This consolidation phase is crucial for investors to understand. The asset is now testing a major resistance point.
A successful breakout above this key resistance level could signal the start of a powerful rally. The overall market sentiment and institutional activity will likely be the deciding factors. The coming weeks will be telling for the future price direction.
Market Overview and Technical Context
Market participants are closely monitoring the current technical setup as the asset finds equilibrium. Recent data shows the cryptocurrency stabilizing around $109,500 after testing critical support.
Current Price Action and Key Resistance Zones
The digital currency bounced strongly from the $106,500 support level. This area aligns with both a bearish channel boundary and Fibonacci retracement.
BTC briefly moved above $109,800, turning this into short-term support. The $112,000 zone now acts as intermediate resistance, overlapping with the 3-month EMA.
Technical Indicators and Momentum Analysis
Technical momentum shows mixed signals across timeframes. The Stochastic RSI formed a bullish crossover on daily charts while remaining oversold weekly.
The RSI at 50.7 indicates neutrality. Chaikin Money Flow signals marginal inflows at 0.03. These readings suggest balanced momentum.
| Technical Level | Price Point | Significance |
|---|---|---|
| Primary Support | $100,000-$110,000 | Robust buying zone |
| Secondary Support | $106,500 | Critical Fibonacci level |
| Immediate Resistance | $112,000 | 3-month EMA overlap |
| Upper Resistance | $114,600 | Channel boundary |
| Invalidation Point | $123,400 | Breakout confirmation |
Analysts note that maintaining above $112K could trigger upward momentum. The 50-week EMA near $100,000 provides additional downside protection.
Understanding Bitcoin Resistance Levels Breakout Potential
Technical analysis reveals a critical battle unfolding near the $112,000 mark. This area is not a single line but a layered structure of key resistance. A decisive break here could signal a major trend change.

Crypto analyst Michaël van de Poppe notes that holding above $112K may fuel a surge toward $135,000. However, a true reversal requires a weekly close above $115,000. This confirms the exit from the bearish channel.
The next technical targets lie between $119,000 and $125,500. These levels are based on Fibonacci extensions. Understanding these support and resistance lines is key for traders.
Beneath the current price, strong support exists near $105,000. This level must hold to maintain the bullish setup. The $112,000-$114,000 zone is a compression area where the next big move will likely begin.
Institutional, Whale, and Macro Influences on Bitcoin
Wall Street’s growing embrace of crypto products is creating new market dynamics. Major financial players are now significant drivers of price action.
Institutional Inflows, ETF Dynamics, and Regulatory Signals
BlackRock’s IBIT ETF and Fidelity’s Wise Origin Bitcoin Fund have attracted over $25 billion in combined flows. This demonstrates strong institutional interest from retirement accounts and corporate treasuries.
CoinShares data shows continued net inflows despite market volatility. Regulatory policy signals remain supportive for investor participation.

Whale Activity and Macro Economic Crosscurrents
Large holders are actively influencing market sentiment. On-chain trackers show “Bitcoin OG” closed a $227.8 million short position.
Trader 0xc2a3 flipped to a $45 million long position with 19x leverage. This whale activity creates upward pressure as short interest unwinds.
Long-term holders now control a record 15.6 million BTC. This reduces exchange supply to five-year lows.
Macro economic factors also impact crypto markets. The upcoming U.S. CPI report will influence Fed policy tone. Geopolitical developments affect global risk appetite.
Potential Price Paths and Future Market Trends
The cryptocurrency’s next directional move will likely follow one of several distinct paths. Market participants are weighing both corrective scenarios and bullish outlooks for the coming months.

Current technical structure suggests natural consolidation after recent volatility. This range-bound action could lead to different outcomes.
Short-Term Corrections and Consolidation Patterns
Some analysts project a potential decline to form a higher low around $80,000-$90,000. This would provide traders with attractive entry points before recovery.
Support zones at $107,000 and $72,000 are being closely monitored. A decisive reclaim of $123,250 would invalidate this corrective scenario entirely.
Contrarian strategists like John Glover warn of deeper retracement to $70,000-$80,000. They argue the five-wave Elliott structure may have already peaked.
Forecasting a Rally Toward New All-Time Highs
Should the digital asset maintain momentum above $112,000, analysts expect a surge toward $135,000 or higher. The near-term path includes intermediate targets between $119,000 and $125,500.
Market veterans project cycle highs around $180,000 tied to M2 liquidity growth. The $130,000-$137,000 zone represents a potential year-end target range.
Community sentiment remains generally optimistic despite recent pullback concerns. Long-term holders continue accumulating, supporting the bullish outlook.
| Scenario Type | Price Range | Timeframe |
|---|---|---|
| Conservative Correction | $100,000-$107,000 | 2-4 weeks |
| Deep Retracement | $70,000-$80,000 | 1-2 months |
| Immediate Rally | $119,000-$125,500 | Near term |
| Cycle High Target | $130,000-$137,000 | Year end |
| Bullish Peak | $180,000 | Next cycle |
The crypto market’s future trend depends on which support and resistance levels hold. Both correction and rally scenarios present distinct opportunities for investors.
Conclusion
All eyes remain fixed on the $112K price zone, which will likely dictate the digital asset’s trajectory in the coming weeks. This critical threshold represents a major inflection point for the entire crypto ecosystem.
A successful break above this barrier could ignite fresh buying interest and propel the asset toward $135,000-$150,000 targets. However, failure to overcome this level might lead to consolidation or a modest corrective move.
Investors should monitor institutional activity, ETF flows, and key support near $107,000. These data points provide crucial signals about underlying momentum.
The market maintains a cautiously optimistic sentiment despite near-term volatility concerns. Analysts emphasize that weekly closes above $115,000 would confirm the bullish outlook while acknowledging risk factors like macroeconomic policy shifts.


No comments yet