
Welcome to your essential guide for understanding digital asset movements. In the fast-paced world of crypto trading, visual tools are key to success. This guide focuses on a powerful method for interpreting the market.
Bitcoin leads the cryptocurrency space with a massive valuation. Its influence makes skilled analysis crucial for any investor. Mastering this skill helps you navigate volatility with greater confidence.
Recent developments highlight its growing importance. Major financial players like JPMorgan Chase now accept BTC as loan collateral. This institutional adoption adds new layers to market evaluation.
We will break down how to read a candlestick chart effectively. You will learn to spot patterns that reveal potential price direction. This knowledge forms the foundation for smart trading decisions in the dynamic crypto ecosystem.
Introduction to Candlestick Analysis and Its Role in Crypto Trading
The art of reading candlestick formations dates back centuries but remains highly relevant for modern digital asset evaluation. These visual tools help traders interpret complex market data quickly and effectively.
Understanding Candlestick Basics
Each candlestick tells a story about market activity during a specific time period. The body shows opening and closing values, while the wicks reveal highest and lowest points reached.
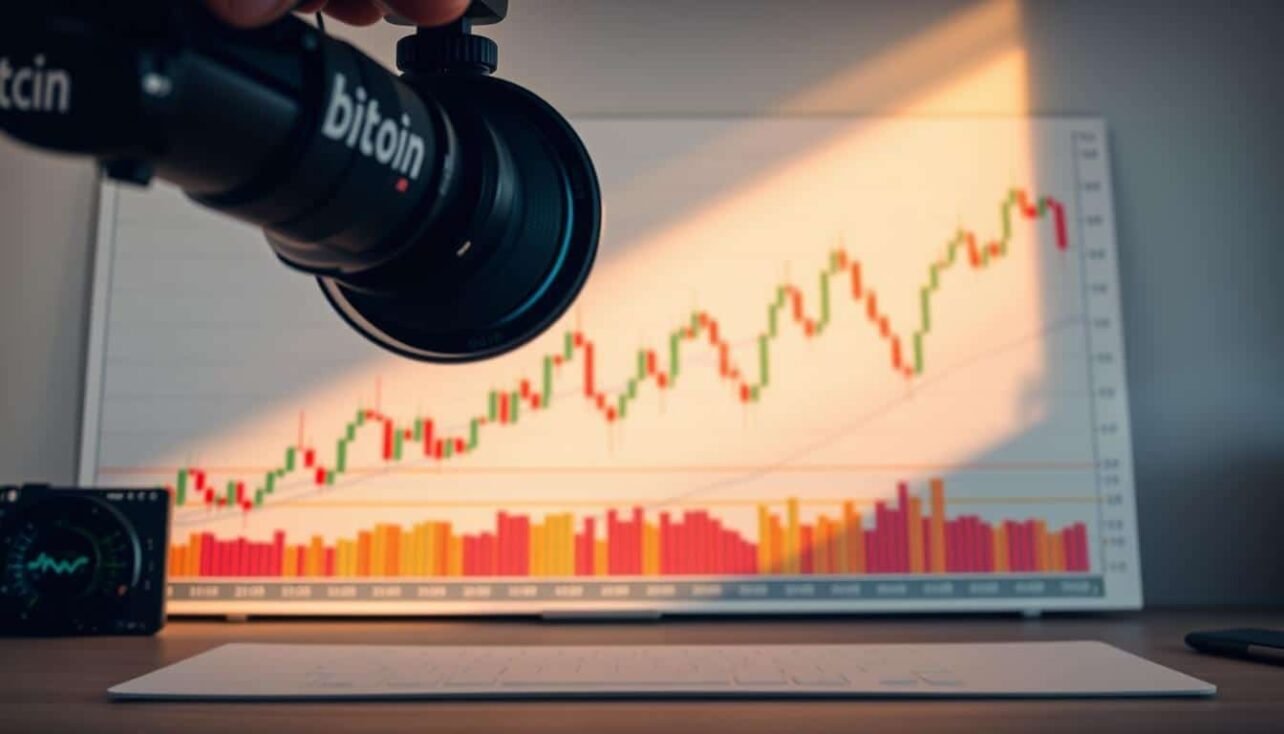
Color coding provides immediate visual cues about market sentiment. Green typically indicates upward movement, while red signals downward pressure. Learning to read these crypto candlestick charts is essential for successful trading.
Why Bitcoin Leads the Crypto Market
Bitcoin maintains its position as the dominant cryptocurrency with the largest market capitalization. Its movements often set the tone for the entire digital asset ecosystem.
The limited supply of 21 million coins creates unique scarcity dynamics. This fundamental characteristic makes technical analysis particularly valuable for long-term investment strategies.
| Market Feature | Bitcoin | Traditional Markets | Other Cryptocurrencies |
|---|---|---|---|
| Market Leadership | Primary benchmark | Established indices | Follow Bitcoin trends |
| Supply Dynamics | Fixed maximum supply | Variable supply | Various supply models |
| Analysis Relevance | High predictive value | Established methods | Bitcoin-dependent |
Understanding these patterns gives traders valuable insights that apply across the broader cryptocurrency landscape. Bitcoin’s influence makes it the primary focus for market analysis.
Exploring BTC Price Chart Candlestick Analysis
The ability to decode market sentiment through graphical representations separates novice investors from seasoned professionals. These visual tools reveal critical information about buyer and seller behavior.
Recognizing formation types helps traders anticipate potential market movements. Each pattern tells a story about the balance between optimism and caution.
Defining Key Candlestick Patterns
Bullish formations like the Three Outside Up suggest upward momentum may continue. This pattern currently appears on daily timeframes.
Bearish signals include the Evening Star, which recently completed on weekly charts. Such formations warn of potential downward pressure.
Neutral patterns like Doji formations indicate market indecision. They often precede significant trend changes.
| Pattern Type | Market Signal | Timeframe Strength | Recent Example |
|---|---|---|---|
| Bullish | Upward momentum | Strong on daily | Three Outside Up |
| Bearish | Downward pressure | Reliable on weekly | Evening Star |
| Neutral | Market indecision | All timeframes | Doji formations |
How to Read BTC Chart Data
Analyzing formations across different periods provides valuable insights. Longer timeframes typically offer more reliable signals than shorter intervals.
Current market data shows patterns across multiple periods from 15-minute to monthly charts. The daily range between $110,665 and $111,128 demonstrates how formations develop within trading sessions.
Traders should verify emerging patterns with subsequent price action before making decisions. Real-time candlestick data helps confirm these technical signals.
Technical Analysis Tools for the BTC Market
Beyond candlestick formations, a suite of technical analysis tools provides deeper market insights. These technical indicators help traders gauge momentum and identify the underlying direction of trends.
 trading market. The scene depicts an array of dynamic charts, graphs, and visualizations against a backdrop of a dark, moody cityscape with skyscrapers and a night sky. The indicators include candlestick patterns, moving averages, Bollinger Bands, MACD, RSI, and others, all rendered with a high level of photorealism and precision. The lighting is dramatic, with highlights and shadows accentuating the technical details. The composition creates a sense of depth and complexity, reflecting the nuanced nature of technical analysis in the cryptocurrency space.")
Current data shows a Neutral market stance. This balanced reading makes understanding these tools especially critical.
Moving Averages and Technical Indicators
Moving averages smooth out data to reveal clearer trends. Simple and Exponential averages are the most common types.
They act as dynamic support and resistance levels. The current Neutral signal from these indicators suggests a period of consolidation.
Oscillators like the RSI measure momentum and overbought/oversold conditions. Their current Neutral reading aligns with the overall market summary, indicating a lack of extreme momentum in either direction.
Chart Patterns and Trend Analysis
Patterns like triangles and head-and-shoulders formations complement candlestick analysis. They help identify potential breakout points from consolidation ranges.
Trend analysis involves studying peaks and troughs. This determines if the market is in an uptrend, downtrend, or moving sideways.
Combining these methods creates a powerful framework. It helps traders navigate neutral periods and prepare for the next significant trend move.
Interpreting Market Data and Trading Signals
Volume analysis provides critical context for interpreting market trends and distinguishing between genuine momentum and temporary fluctuations. This data helps traders validate the strength behind price movements.

Analyzing Trading Volume and Price Trends
Bitcoin’s current 24-hour trading volume of $53.33 billion offers valuable insights into market activity. High volume confirms the significance of price movements and validates emerging patterns.
The volume-to-market cap ratio of 0.0185 helps assess market liquidity. Higher ratios typically indicate stronger conviction behind trends and more active participation.
Volume spikes often accompany significant breakouts or breakdowns. Declining volume during price moves may signal weakening momentum and potential reversals.
| Timeframe | Price Change | Trading Signal | Market Strength |
|---|---|---|---|
| 24 Hours | +0.30% | Neutral | Moderate |
| Weekly | +2.05% | Bullish | Strong |
| Monthly | -1.43% | Caution | Weak |
| Annual | +63.92% | Bullish | Very Strong |
Multi-timeframe analysis reveals different momentum dynamics. The daily range between $110,665 and $111,128 helps identify key support and resistance levels.
Combining volume confirmation with price action increases signal reliability. Breakouts with above-average volume have higher probability of sustained moves.
Real-Time Data Insights and Case Studies
The intersection of breaking news and technical signals creates powerful opportunities for informed decisions. This section examines how current market developments validate analytical frameworks.

Today’s crypto landscape shows Bitcoin trading around $111,721 USD. Recent performance indicates consolidation patterns with potential for movement.
How Current Market Facts Support Analysis
Institutional adoption milestones strengthen technical signals. JPMorgan Chase’s plan to accept Bitcoin as loan collateral by late 2025 demonstrates growing legitimacy.
Spot Bitcoin ETFs show $446 million in weekly inflows. This institutional demand provides fundamental support for technical levels.
Regulatory approvals like Relai’s MiCA framework enhance market stability. Such developments can influence momentum in the crypto ecosystem.
Case Study: Bitcoin’s Performance Metrics
Bitcoin’s journey from $2 USD in 2011 to $126,272 USD in 2025 illustrates remarkable growth. The current position represents a healthy consolidation zone.
Trading approximately 11.5% below all-time highs, this suggests potential for upward movement. Historical lows and highs provide context for current price action.
Integrating real-time data with pattern recognition creates a comprehensive approach. This methodology helps validate signals across different time frames.
Integrating Analysis into Your Trading Strategy
Building a comprehensive trading framework involves synthesizing technical signals with fundamental market factors. This systematic approach transforms raw data into actionable trade ideas for your portfolio.

Using Web Sources to Validate Trading Decisions
Effective traders cross-reference multiple web sources before executing any trade. Community forums and professional screeners provide valuable validation for your watchlist.
Current technical ratings show conflicting signals across different timeframes. This highlights the importance of maintaining a balanced overview before making portfolio decisions.
| Timeframe | Technical Rating | Signal Strength | Strategy Implication |
|---|---|---|---|
| 1-Day | Sell | Weak | Short-term caution |
| 1-Week | Buy | Moderate | Medium-term opportunity |
| 1-Month | Buy | Strong | Long-term positioning |
| Multi-timeframe | Mixed | Variable | Requires careful analysis |
Platforms like TradingView allow direct trade execution after signal confirmation. This streamlines the process from analysis to portfolio adjustment.
Regular watchlist reviews using multiple screeners help identify high-probability trade setups. This disciplined approach adapts well to changing market conditions.
Conclusion
Successful navigation of the digital asset market demands more than just pattern recognition. This guide has equipped traders with a comprehensive framework for interpreting crypto movements through multiple lenses.
The integration of visual formations with technical indicators creates a powerful trading strategy. Understanding how volume, moving averages, and momentum interact provides deeper market insights.
Bitcoin‘s journey demonstrates why flexibility remains crucial in cryptocurrency investing. Patterns offer probabilities, not certainties, requiring confirmation from broader trends and fundamental developments.
This multi-dimensional approach helps traders build resilient portfolio strategies. The dynamic crypto landscape continues to evolve, making ongoing education essential for long-term success.
No comments yet