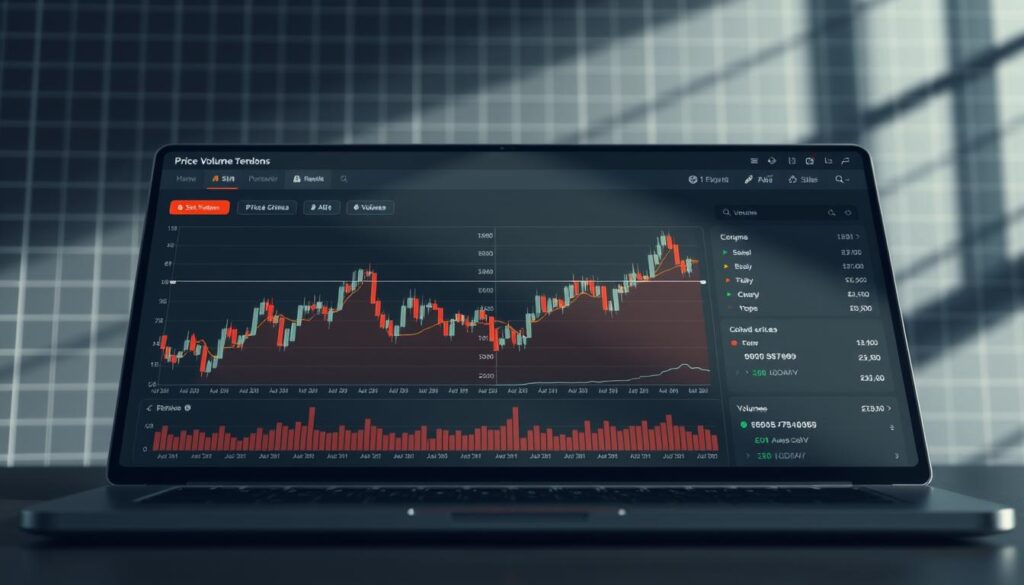
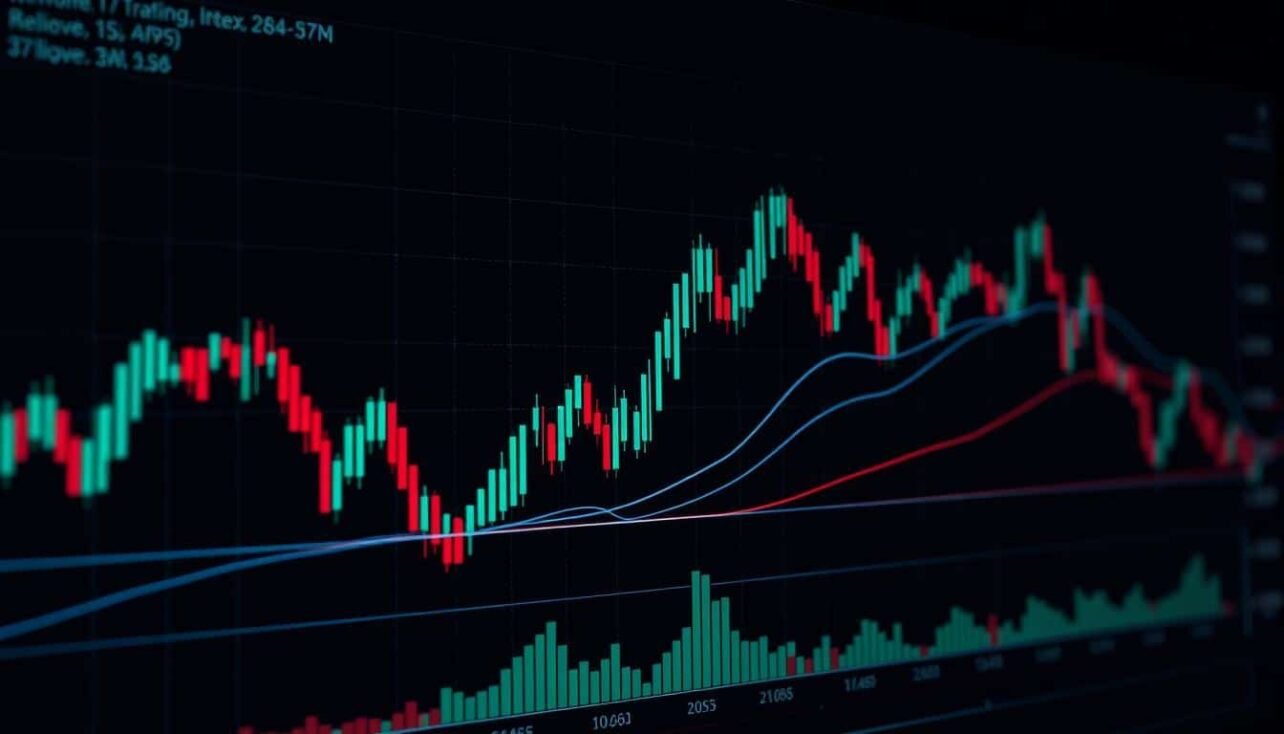
Welcome to your guide on using powerful tools for digital asset trading. This world moves fast, and having a clear strategy is key. We will explore a set of mathematical calculations that help make sense of price action.
These tools transform raw data into visual signals. They help you understand current conditions and spot potential opportunities. There are many types, from simple trend followers to complex oscillators.
Mastering these concepts is vital for success. The volatile nature of this space demands a systematic approach. This guide is designed for everyone, from beginners to those refining their skills.
We will cover momentum, volume, and volatility tools. Our goal is to build your knowledge from the ground up. You will learn how to apply these methods with confidence in your trading decisions.
Introduction to Crypto Market Analysis Technical Indicators
Many successful traders rely on a specific methodology to navigate the constant fluctuations of digital asset values. This approach, known as technical analysis, involves studying historical price data and chart patterns.
The goal is to identify probabilities for future movement. It differs from fundamental analysis, which looks at a project’s intrinsic value. Instead, this method focuses purely on the action of the price itself.
Why Technical Analysis Matters in Crypto Trading
This form of evaluation is particularly powerful in the digital asset space. Markets operate 24/7 and can experience sharp price swings. Sentiment and psychology play a huge role in these movements.
Widely used technical indicators can create a self-fulfilling prophecy. When many participants act on the same signals, their collective actions often push the price in the expected direction. This adds weight to the tools’ effectiveness.
Ultimately, these indicators provide a structured framework. They help traders make logical decisions based on data, not emotion. This discipline is key to managing risk and identifying potential entry and exit points.
Understanding Technical Analysis: Foundations and Benefits
All visual tools used by traders are built upon the raw inputs of price action, transaction volume, and directional momentum. These three elements form the bedrock of chart evaluation. Mastering their relationship is the first step toward making informed choices.

The Role of Price, Volume, and Trends
Price data represents the consensus of value at any moment. It is the most fundamental input for all calculations. Charts visually represent this historical information.
Volume shows the strength behind a price move. High volume confirms that a trend has broad participation. Low volume suggests a move may lack conviction and reverse.
Identifying the trend is about determining the dominant direction. Tools help smooth out noise to see the underlying current. Following the trend significantly improves the odds of a successful outcome.
How Technical Analysis Informs Trading Decisions
This methodology turns chaotic data into clear signals. It provides objective criteria for entry and exit points. This removes emotion from the process.
Combining insights from price, volume, and trends creates a powerful framework. For example, a price breakout supported by high volume is a strong signal. This systematic approach helps manage risk effectively.
| Core Element | Primary Function | Key Insight Provided |
|---|---|---|
| Price | Records transaction value | Shows market sentiment and value consensus |
| Volume | Measures transaction quantity | Confirms the strength or weakness of a price move |
| Trend | Identifies market direction | Highlights the path of least resistance for prices |
Identifying Core Technical Indicators for Cryptocurrency
Building a successful strategy involves mastering the core categories of analytical tools available to traders. These mathematical formulas transform raw price information into actionable signals. Understanding their distinct purposes helps you choose the right tools for your approach.

Overview of Trend, Momentum, and Volume Indicators
Trend-following tools help identify the dominant direction of price movement. They smooth out daily fluctuations to reveal the underlying current. Following the trend significantly improves your probability of success.
Momentum measurements assess the speed and strength of price changes. They can signal when an asset is overextended and due for correction. These tools help time your entries and exits more effectively.
Volume-based calculations confirm whether price moves have genuine support. High volume validates a trend’s strength, while low volume suggests weakness. This distinction separates sustainable moves from temporary fluctuations.
| Indicator Category | Primary Function | Common Examples |
|---|---|---|
| Trend Indicators | Identify market direction | Moving Averages, MACD |
| Momentum Tools | Measure price change speed | RSI, Stochastic Oscillator |
| Volume Analysis | Confirm move strength | OBV, Volume Profile |
Successful traders often combine tools from different categories. This creates a more complete picture of market conditions. Each category answers specific questions about price behavior and trend validity.
Step-by-Step Guide to Applying Technical Indicators
The transition from theory to application begins with proper platform setup. Choosing the right software is your first critical decision. Look for platforms that offer comprehensive charting capabilities.

Setting Up Your Trading Charts and Tools
Start by selecting two to four complementary tools that serve different purposes. Avoid redundancy by combining trend-following, momentum, and volume-based options. This creates a balanced analytical framework.
Customize your time frames based on your preferred approach. Day traders typically use shorter intervals, while position traders focus on longer periods. Adjust settings to match digital asset volatility patterns.
Organization is key to maintaining chart clarity. Place primary indicators on the main price chart and secondary tools in separate windows below. This prevents visual overload while keeping essential data accessible.
Always practice with demo accounts before using real capital. This allows you to develop proficiency without financial risk. Test different combinations and observe how signals interact in various conditions.
Establish a consistent workflow for your daily routine. Review charts at the same time each day and follow a systematic process. This discipline ensures reliable application of your chosen methods.
Mastering Crypto Market Analysis Technical Indicators for Better Trading
True mastery emerges when mathematical calculations transform from isolated signals into an integrated decision-making framework. This evolution separates casual users from skilled practitioners who consistently apply these tools.

Effective application begins with selectivity rather than quantity. Choose one or two complementary tools that align with your personal approach and risk tolerance. Deep understanding of a few reliable instruments beats superficial knowledge of many.
Context determines signal meaning. The same reading may suggest different actions in trending versus ranging conditions. Develop pattern recognition by observing how your chosen tools behave during various market phases.
These mathematical aids should confirm price action rather than drive decisions independently. They work best when supporting sound risk management principles. Always practice new combinations in demo environments first.
| Mastery Level | Tool Focus | Interpretation Approach | Application Strategy |
|---|---|---|---|
| Beginner | 1-2 basic indicators | Direct signal following | Simple entry/exit rules |
| Intermediate | 2-3 complementary tools | Contextual interpretation | Confirmed price action |
| Advanced | Integrated system | Pattern recognition | Risk-managed framework |
Progress from simple combinations to sophisticated systems as experience grows. For comprehensive guidance on this journey, explore this resource on mastering technical analysis. Consistent practice develops the intuition needed for reliable decision-making.
Diving Deeper into Volume, Trend, and Momentum Strategies
Volume and momentum strategies provide essential confirmation signals for digital asset traders. These tools help validate whether price movements have genuine support or represent temporary fluctuations.
Successful practitioners combine these measurements to create a comprehensive picture of market conditions. This approach separates sustainable trends from short-lived price spikes.
Evaluating Volume-Based Indicators like OBV and A/D Line
On-Balance Volume (OBV) tracks cumulative buying and selling pressure over time. A rising OBV suggests intense accumulation, while falling OBV indicates distribution.
The Accumulation/Distribution Line provides more nuanced volume analysis. It weights volume based on where prices close within their daily range. This helps identify institutional activity before it becomes obvious in price action.
Understanding Momentum Indicators: RSI, MACD, and Stochastic Oscillator
The Moving Average Convergence Divergence (MACD) combines trend-following and momentum characteristics. It measures the relationship between two exponential moving averages. Crossovers between the MACD line and signal line generate trading signals.
The Relative Strength Index (RSI) identifies overbought conditions above 70 and oversold conditions below 30. However, these levels can remain extreme during strong trends. For deeper insights into momentum indicators, explore additional resources.
The Stochastic Oscillator compares current prices to recent ranges. Its fast and slow lines generate timing signals for entries and exits. Crosses above 80 or below 20 are particularly significant.
| Indicator Type | Primary Function | Key Signal | Strength Measurement |
|---|---|---|---|
| OBV | Volume accumulation | Directional flow | Buying/selling pressure |
| MACD | Trend momentum | Line crossovers | Movement acceleration |
| RSI | Price momentum | Overbought/oversold | Extreme conditions |
These tools help assess whether trends are gaining or losing strength. Recognizing divergences—when indicators move opposite to price—often provides reliable early warning signals. For practical application guidance, see this chart analysis tutorial.
Optimizing Your Trading Strategy with Complementary Tools
The art of effective trading lies in harmonizing multiple complementary tools to validate signals and reduce false alarms. This approach transforms individual measurements into a cohesive decision-making system.
Experienced practitioners typically combine two to four instruments from different categories. This creates a balanced framework that addresses various aspects of price behavior.
Combining Indicators for Effective Entry and Exit Points
Strategic combinations help identify high-probability entry and exit points. For example, using moving averages to establish trend direction while employing RSI for timing creates powerful synergy.
Volume-based tools add crucial confirmation to momentum signals. When multiple instruments align, confidence in trading decisions increases significantly.
Support and resistance levels identified through price action become more reliable when confirmed by other measurements. This multi-layered approach reduces guesswork.
| Primary Tool | Complementary Tool | Combined Function | Signal Strength |
|---|---|---|---|
| Moving Average | RSI Oscillator | Trend direction + timing | High probability |
| Volume Indicator | Price Breakout | Confirmation + strength | Strong validation |
| Support Level | Momentum Tool | Entry point + direction | Reliable setup |
Testing combinations in demo accounts before live implementation is essential. Different market conditions may require adjusted tool selections for optimal performance.
Practical Tips for Real-Time Technical Analysis Implementation
Effective implementation requires bridging the gap between theoretical knowledge and real-time execution. Start by practicing with demo accounts before risking actual capital. This builds confidence in applying your chosen methods.
Align your tools with your personal approach and available time. Different assets may respond uniquely to the same signals. Always let price action lead while using measurements for confirmation.
Emotional control becomes crucial when signals contradict your expectations. Stick to your predefined rules rather than making impulsive decisions. This discipline separates successful participants from others.
Integrate risk management directly into your framework. Use support levels and measurements to determine stop-loss placement. Proper position sizing protects your capital during unexpected moves.
Adapt your approach based on current conditions. Trending environments require different strategies than ranging periods. Your tools should help identify which phase the asset is experiencing.
Schedule regular reviews rather than constant monitoring. This prevents information overload and analysis paralysis. Focus on the most relevant data points for your strategy.
Consider automation for repetitive tasks. Set alerts for specific conditions to avoid missing opportunities. Trading journals provide valuable feedback for continuous improvement.
Conclusion
The true value of price evaluation instruments emerges when they support rather than dictate your strategy. These mathematical tools provide valuable data, but their effectiveness depends on proper application.
Start by mastering a few complementary measurements that align with your trading style. Focus on understanding how they interact with price action and trend direction. This focused approach prevents information overload.
Remember that even sophisticated calculations cannot replace sound risk management. They should confirm what you see in prices and volume. Successful traders use these instruments to make informed decisions.
Continuous practice and adaptation are essential. Different market conditions require adjusted approaches. Your skills will develop over time through consistent application and learning.
Begin with demo accounts to build confidence. Focus on a small set of technical indicators that measure momentum and strength. This foundation will serve you well across various digital asset classes.


No comments yet