
Understanding repeating patterns helps new investors make sense of sudden surges and sharp drops. These cycles are driven by supply and demand, news events, and human emotion. Compared with traditional finance, the crypto market often moves faster and with more volatility.
This guide previews a clear roadmap: definitions, the four phases, bull vs bear differences, historical examples, sentiment drivers, and easy indicators for beginners. Bitcoin is the reference asset many traders watch first, since its direction can sway broader price action.
The goal is practical: turn confusing price movements into a simple framework you can use to read headlines and charts. This is educational content, not a prediction tool. No method can time exact tops or bottoms, but a cycle view improves timing, calm decision-making, and risk awareness for everyday investors.
To learn more about recurring patterns, read a detailed overview. For step-by-step analysis for beginners, see this beginner’s analysis guide.
What Are Crypto Market Cycles and Why They Matter
Seeing price patterns over time turns random noise into a simple roadmap. A market cycle is a repeating sequence where prices rise, cool off, fall, then stabilize. Zooming out makes that rhythm easier to spot and act on.

How this space differs from traditional markets
Trading runs 24/7 and many assets have thinner liquidity. That combination, plus low barriers to entry and social media-driven flows, makes moves faster and increases volatility.
Core forces behind every cycle
At the heart are supply and demand imbalances, sudden news events, and swings in investor emotion. These drivers repeat across markets and help explain large price movements.
Bitcoin’s role as the engine
Bitcoin dominance often sets direction for altcoins. Events like a bitcoin halving reduce new issuance roughly every four years and can strengthen scarcity narratives, though macro factors also matter.
Why this matters: recognizing cycles helps investors avoid chasing hype and supports clearer entries, exits, and position sizing. For deeper seasonality patterns, see crypto market seasonality analysis.
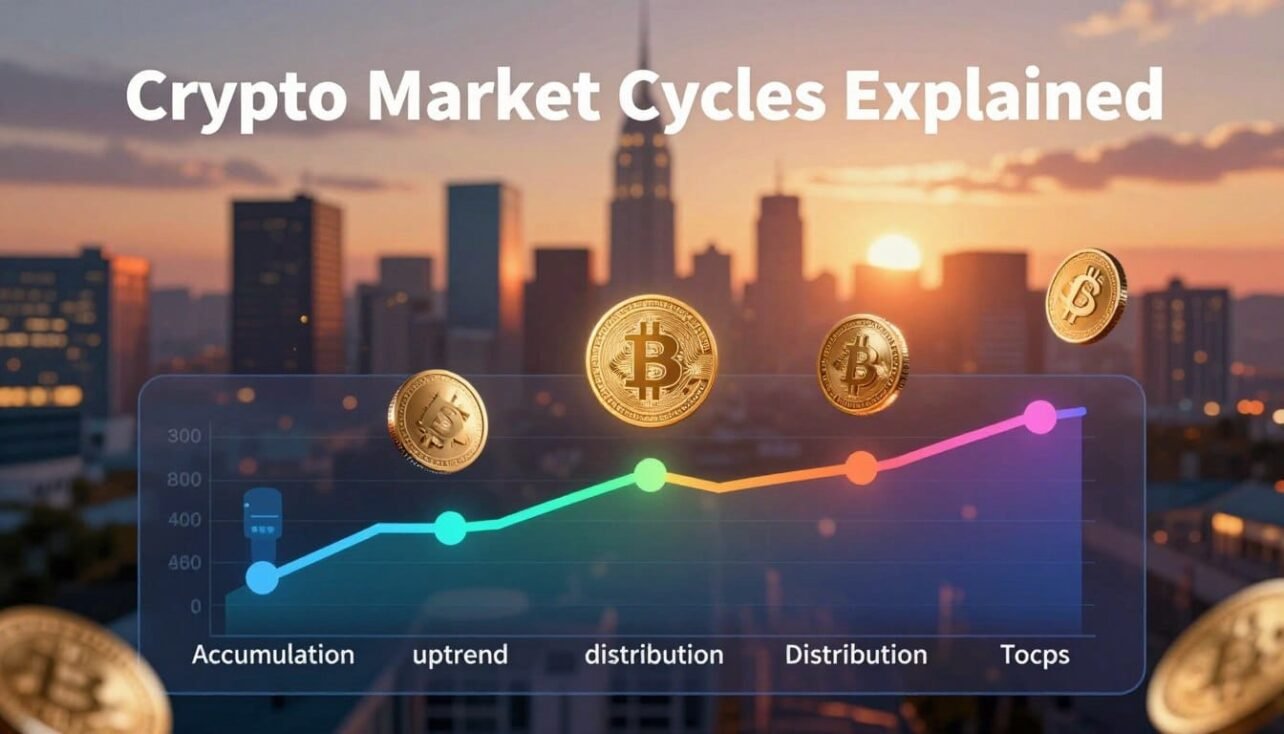
Crypto Market Cycles Explained: The Four Phases You’ll See Repeated
Recognizing the four recurring phases helps traders match price action to crowd behavior.

Accumulation phase: “the worst is behind us”
After a deep sell-off, prices flatten and media interest fades. Volume is moderate while larger holders quietly buy from discouraged sellers.
Accumulate means smart money slowly builds positions before broad optimism returns.
Markup phase: rising trading volume and new all-time highs
Uptrends strengthen as participation grows and trading volume rises. Prices push toward new all-time highs and sentiment shifts toward hope and euphoria.
Distribution phase: profits taken near highs
Ranges and choppy action appear near peaks. Whales and long-term holders start taking profits while public sentiment splits between greed and worry.
Markdown phase: fear-driven sell-offs and bottom formation
Negative headlines and risk-off behavior trigger panic selling. Capitulation ends when selling exhausts and price stabilizes, setting the stage for accumulation again.
Emotional arc: apathy → hope → euphoria → fear. These feelings map to real choices: low allocation early, FOMO at peaks, and panic selling near lows.
Sentiment tools: indicators like a Fear & Greed-style index give context but shouldn’t be used alone to time entries or exits.
Bull Market vs Bear Market in Crypto
Bull and bear phases show how crowd behavior turns price trends into clear directional runs.

What defines a bull run
A bull market shows higher highs and higher lows with visible momentum. Rising participation, more on-chain activity, and media positivity push prices up.
Signs to watch:
- Higher volumes and expanding trading activity
- Narrative-driven FOMO that brings new buyers
- Risk-on flows where smaller tokens often outperform late in the run
What defines a bear market
A bear market has prolonged drawdowns and falling interest. Liquidity thins and investors switch to cash or defensive holdings.
Behavioral cues: stalled rallies, lower volumes, and growing risk-off positioning across exchanges and funds.
Why big corrections of 60–80% happen
Large corrections are common in cryptocurrency because leverage, thin liquidity, and reflexive sentiment amplify moves.
Example: euphoria pulls prices to extremes, then stalled rallies lead to breakdowns, selling cascades, and lower lows until a bottom forms.
How to think about time and probability: short-term swings are noisy. Use cycle context to avoid buying peaks and panicking before a potential bottom.
Major Crypto Market Cycles So Far: Key Events and What They Taught Investors
Historical turning points highlight how sentiment, regulation, and technology combine to move prices.

2013 boom and Mt. Gox shock
In 2013 bitcoin surged above $1,000 in an early adoption run. Confidence collapsed when Mt. Gox failed, and value fell over 80%.
Lesson: custody and exchange risk can wipe out gains fast.
2017 ICO mania
Easy fundraising and hype pushed prices to new extremes near $20,000. Regulatory crackdowns followed and many projects lost value.
Lesson: speculative fundraising can dilute real utility and harm investors.
2021 DeFi boom and institutional flow
Technological developments and DeFi demand drew institutional buyers like Tesla and MicroStrategy. Bitcoin hit $69,000 as mainstream attention grew.
Lesson: institutional entry can lift prices, but also raise correlation with broader finance.
2022–2023 markdown and recovery signs
Inflation and rising rates pressured risk assets. The FTX collapse accelerated the sell-off and helped form a bottom near $15k.
Lesson: macro news and concentrated failures can deepen declines quickly.
Where we stand now
Post-2024 saw a new all-time high, then consolidation. Halving narratives and liquidity shape bull-run expectations, but no single indicator guarantees the next move.
Practical advice: avoid leverage-driven euphoria, plan profit-taking, and respect liquidity risk.
What Drives Crypto Market Sentiment and Cycle Turning Points
Investor narratives and large orders shape turning points faster than balance sheets. Market sentiment is measurable and moves prices when supply and demand shift quickly.
Fear & Greed Index
The fear greed index runs 0–100. Zero means extreme fear; 100 means extreme greed. It uses volatility, momentum, and social signals.
Beginners should use it as a temperature check, not a buy/sell trigger. Extreme fear can mark bottoms; extreme greed often lines up with tops.
Regulatory and Tech Events
Regulatory news like ETF approvals or bans can reprice perceived legitimacy and access in hours. Upgrades and new protocols spark demand spikes when narratives align with rising prices.
Institutional Flows and Macro
Large ETFs, hedge funds, and corporate buyers add liquidity but can raise volatility through big inflows or forced selling.
- Macro factors: U.S. inflation and interest rate shifts change risk appetite.
- Turning points: tops form when greed meets bad news; bottoms form when fear peaks and selling dries up.
How to Spot the Current Phase Using Data and Indicators
Combine on-chain readings, volume, and sentiment to cut through noisy price movements and form a view.
On-chain signals that matter
Watch exchange supply, network activity, and hash rate. Falling exchange supply can signal accumulation. Rising active addresses and on-chain transfers suggest renewed demand.
A rising hash rate usually shows network health and miner confidence. Sharp drops in hash rate can increase volatility and hint at short-term stress.
Halving and the four-year rhythm
History shows major rallies after prior bitcoin halving events (2012→2013, 2016→2017, 2020→2021). Still, institutional flows and macro news now shorten timing and change amplitude.
Volume, momentum, and simple technicals
Confirm breakouts with rising trading volume. Weak moves with low volume often fail or mark distribution.
Beginner indicators: RSI flags overbought (>70) or oversold (
Sentiment checks and the final workflow
Scan social spikes, headlines, and fear greed readings to detect euphoria or capitulation. Align sentiment with price and on-chain data before acting.
- Step 1: check macro calendar and halving context
- Step 2: read exchange supply, activity, and hash rate
- Step 3: confirm with volume, RSI, moving averages, and MACD
- Step 4: sanity-check with sentiment and headlines
Conclusion
A simple phase framework turns noisy charts into actionable choices.
Understanding the four phases — accumulation, markup, distribution, markdown — helps investors read price moves and headlines. Use on-chain data and sentiment tools to identify where a market sits in the cycle.
Practical steps: size positions, plan entries and exits, and avoid emotional trades that erase profits. Watch Bitcoin as a leading indicator for the broader crypto market, while remembering macro and regulation can change the playbook.
Cycles repeat but never predict perfectly. Keep learning, track indicators across runs, and prioritize risk management and patience over guessing tops or bottoms.
FAQ
What are the main phases of a crypto market cycle?
A typical cycle repeats four phases: accumulation (buyers slowly rebuild positions after a crash), markup (prices rise, higher volume, new all-time highs), distribution (early sellers and large holders take profits as sentiment splits), and markdown (sharp sell-offs, fear, and eventual bottom formation).
How does the digital-asset cycle differ from traditional financial markets?
Digital-asset cycles tend to move faster and show larger percentage swings due to smaller market depth, higher retail participation, and rapid narrative shifts. News, listings, protocol upgrades, and events like Bitcoin halvings can trigger bigger and quicker sentiment changes than in many legacy markets.
Why is Bitcoin often called the "engine" of the broader ecosystem?
Bitcoin sets price trends, liquidity flows, and investor sentiment across the sector. Large moves in Bitcoin usually drag altcoins along; on-chain metrics and institutional flows into Bitcoin often precede broader market rotations.
What signals indicate the start of a bull run?
Signs include rising trading volume, increasing on-chain activity, expanding media coverage, RSI and moving averages turning bullish, and rising institutional interest such as ETF approvals or large corporate buys. Public sentiment shifts from apathy to hope and then to euphoria.
How can I tell if the market is in a distribution phase?
Look for diverging signals: prices near highs while volume shows spikes on down-days, large transfers from wallets to exchanges, profit-taking by known long-term holders, and mixed headlines where FOMO and caution coexist. That often signals smart money is trimming positions.
Are deep drawdowns of 60–80% normal in this space?
Yes. Due to high volatility and leveraged positions, large corrections are common. Historical cycles have seen substantial retracements; investors should plan for wide drawdowns as part of risk management.
Which on-chain metrics help identify cycle turning points?
Useful measures include exchange supply (coins on exchanges), active addresses and transaction counts (network usage), hash rate (security and miner confidence), and long-term holder behavior. Sharp changes in these metrics often foreshadow phase transitions.
How do Bitcoin halvings influence the four-year rhythm?
Halvings reduce new supply issuance, which historically tightens available supply and has preceded multi-year bullish runs. While not a guaranteed trigger, halvings are a recurring structural factor that markets price in over months to years.
What role do institutional products like ETFs play in cycles?
Institutional vehicles increase liquidity and bring new capital, which can amplify uptrends and stabilize flows. ETF approvals, large fund allocations, or corporate buys often boost confidence and participation, accelerating markup phases.
How should traders use technical tools to confirm a phase?
Combine indicators—RSI for momentum extremes, moving averages for trend direction, MACD for momentum shifts—and confirm with volume and on-chain data. No single indicator suffices; use multiple signals for higher confidence.
Can regulatory news abruptly change cycle direction?
Yes. Regulatory approvals, bans, or enforcement actions can trigger rapid sentiment swings. For example, ETF approvals tend to attract capital and lift prices, while major crackdowns can spark widespread sell-offs and accelerate markdowns.
How does the Fear & Greed Index help with timing?
The index aggregates sentiment signals—volatility, volume, social trends—to show extremes. Extreme fear often signals buying opportunities for long-term investors, while extreme greed can warn of overheated conditions and higher short-term risk.
What lessons did past cycles (2013, 2017, 2021, 2022-23) teach investors?
Each cycle highlighted recurring themes: speculative manias followed by sharp corrections, the impact of security failures and fraud, the importance of regulatory clarity, and how institutional adoption can change scale. Risk management and a long-term view proved crucial.
How can retail investors protect capital during markdowns?
Use position sizing, diversify across assets and strategies, avoid excessive leverage, set stop-losses or plan staged buys, and keep an emergency cash buffer. Focus on fundamentals and avoid emotional trading during high fear.
What indicators signal a recovery after a deep drawdown?
Early signs include falling exchange balances, rising long-term holder accumulation, improving on-chain activity, stabilization of price under key moving averages, and neutral-to-positive macro or regulatory developments.
How do technological upgrades affect cycles and narratives?
Upgrades and new protocols can renew interest, drive real utility, and shift capital into fresh narratives. Successful upgrades that improve scalability or usability often fuel phase shifts by attracting developers, users, and investors.
No comments yet