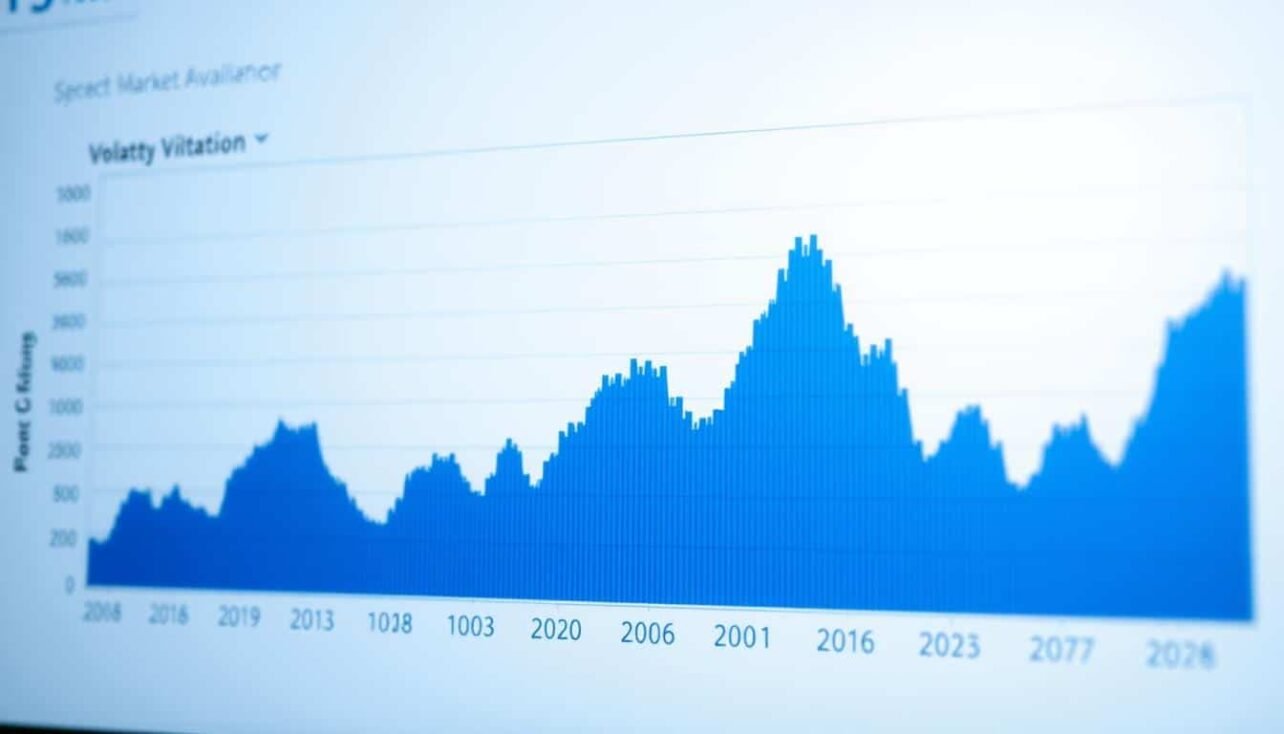
Digital asset prices are known for their rapid changes. Understanding these swings is vital for anyone involved in this space. A volatility index offers a clear way to measure these movements.
This tool provides a single number that reflects the expected turbulence in price. It works much like the VIX does for the stock market. For the cryptocurrency world, it captures the intensity of market shifts.
This analysis explores how these indices are built and used. We will look at past trends and the data behind them. The goal is to give you practical insights for making informed decisions.
Introduction to Cryptocurrency Volatility
Understanding financial turbulence begins with grasping how asset values fluctuate over time. These changes in price create the foundation for measuring risk across different investment landscapes.
What Is Volatility in Financial Markets?
Volatility represents how much an asset’s value swings relative to its average price. It serves as a statistical measure of these movements over specific periods. This concept helps investors assess potential risks.
The VIX, known as Wall Street’s “fear gauge,” typically ranges between 12 and 20 during normal conditions. Readings above this signal extreme stress. For example, during the 2008 crisis, the Dow Jones dropped dramatically.
Comparing Traditional and Crypto Market Fluctuations
Traditional markets show moderate price movements as traders respond to economic news. Established assets like gold average around 1.2% volatility. Major currencies typically range between 0.5% and 1.0%.
Digital currency markets experience much greater swings. Bitcoin’s historical performance demonstrates this difference clearly. The combination of lower liquidity and speculative trading amplifies these effects significantly.
Historical Trends in Cryptocurrency Volatility
The journey of Bitcoin’s value over the past decade showcases dramatic shifts in investor sentiment. Historical data reveals distinct patterns in bitcoin volatility across different time periods.

Key Price Movements and Market Shifts
Bitcoin’s price history includes extraordinary gains and corrections. The 2017 bull run saw BTC increase by over 2,000%, creating unprecedented opportunities. This period demonstrated the extreme movements possible in digital assets.
| Year | Average 30-Day Volatility | Key Price Movement | Market Condition |
|---|---|---|---|
| 2011 | 8.26% | Early adoption phase | High instability |
| 2016 | 2.49% | +125% gain | Moderate growth |
| 2017 | 4.13% | +2,000% surge | Speculative peak |
| 2020 | 5.17% | COVID-19 impact | Stress then recovery |
| 2021 | 4.56% | New all-time highs | Institutional adoption |
The overall trend shows moderating volatility as cryptocurrencies mature. However, prices remain more volatile than traditional assets. This data helps investors understand risk patterns.
Crypto market volatility index analysis: Methodologies and Metrics
The methodology behind tracking financial turbulence in cryptocurrency involves two complementary perspectives on price movement assessment. These approaches provide different insights into asset behavior.

Understanding Implied vs. Historical Volatility
Historical measures examine past price swings using statistical calculations. The standard deviation of daily returns over 30-day or 60-day windows quantifies previous fluctuations.
Implied measures extract forward-looking expectations from options pricing. This reflects what investors will pay today to hedge against future risk. When implied exceeds historical levels, it signals anticipated turbulence.
Essential Metrics for Trend Analysis
Key calculations include variance, standard deviation, and percentile rankings. These allow comparison across different time periods and identification of abnormal conditions.
The cryptocurrency volatility index (CVX) serves as a benchmark similar to traditional finance’s VIX. Proper construction requires careful data selection, as detailed in relevant financial research.
Data Sources and Derivative Instruments in Crypto Markets
Derivative instruments provide a unique window into market expectations for future price swings. These trading tools are essential for building a reliable index.

Specialized platforms dominate this space. For example, Deribit holds over 80% of the options market share. This concentration makes it a primary data source.
Insights from Option Prices and Trading Volumes
The total number of outstanding contracts, or open interest, has grown dramatically. It more than tripled from 2019 levels.
This surge surpassed USD 1 billion by mid-2020. It signals growing market maturity. More traders use these derivatives for hedging and speculation.
Contracts follow clear standards. A symbol like ‘BTC-27MAY20-8750-P’ specifies the asset, expiry, strike, and type. This standardization enables systematic data collection.
Evaluating Liquidity and Bid-Ask Spreads
Liquidity is a critical factor for data quality. It is often measured by the bid-ask spread. This spread represents the transaction cost for traders.
Cryptocurrency options show significantly wider spreads than traditional ones. This difference highlights higher costs and different market structures.
| Market | Mean Bid-Ask Spread | Standard Deviation |
|---|---|---|
| Cryptocurrency Options (Deribit) | 30.2% | 8.4% |
| S&P 500 Stock Options | 8.6% | 4.9% |
Higher liquidity generally produces more reliable signals. Therefore, index calculations often use the most active contracts.
Tools and Techniques for Trend Analysis
The construction of accurate volatility indices relies on advanced statistical techniques and rigorous data filtering. These mathematical tools transform scattered option prices into coherent signals.
Interpolation Methods and Option Selection Criteria
Inverse distance weighting (IDW) serves as a key interpolation technique. This method calculates weights that decrease as distance from the target point increases. Options with expiries closer to the desired 30-day maturity receive greater influence.
Strict filtering criteria ensure only quality data enters the calculation. Contracts with zero trading volume or missing mid-prices are excluded. This prevents distorted signals from illiquid options.

| Interpolation Method | Data Points Used | Weight Calculation | Application Range |
|---|---|---|---|
| Inverse Distance Weighting | Multiple expiries (2-60 days) | Distance-based decay | Flexible term structure |
| Linear Interpolation | Exactly two points | Equal weighting | Adjacent maturities only |
| Error Correction Model | Cointegrated series | Statistical correlation | Tail risk identification |
Error Correction Models for Tail Risk
When two alternative methodologies produce cointegrated index series, their relationship reveals valuable insights. The error correction model captures periods when these series diverge significantly.
This divergence often signals elevated probability of extreme events. Traders can use these models as early warning systems for market turbulence. The mathematical framework provides objective measures rather than subjective judgments.
The Impact of Market Liquidity on Volatility Measures
Market participation levels create the foundation for reliable volatility assessment in cryptocurrency derivatives. When trading activity is thin, price signals become less trustworthy. This affects how accurately we measure expected turbulence.
Three key metrics help evaluate market depth. Trading volume shows immediate activity levels. Open interest reveals sustained participant engagement. Bid-ask spreads indicate transaction costs.
Liquidity Dynamics in Crypto Derivative Markets
The distribution of trading activity varies significantly across different timeframes. Near-term options see much higher participation than longer-dated contracts. This creates uneven data quality for volatility calculations.
| Option Expiry | Average Daily Volume | Typical Bid-Ask Spread | Data Reliability |
|---|---|---|---|
| 1-Day | High | 15-25% | Excellent |
| 1-Week | Moderate | 20-30% | Good |
| 1-Month | Moderate | 25-35% | Fair |
| 6-Month | Low | 40-60% | Poor |
The continuous trading environment creates unique challenges. Liquidity fluctuates throughout each 24-hour cycle. This requires careful methodology adjustments for accurate measurements.
Platform concentration also impacts data quality. Most activity occurs on a few major exchanges. This creates both advantages and risks for volatility assessment.
Investor Implications and Trading Strategies Amid High Volatility
Investors navigating digital asset landscapes must develop specific approaches to handle frequent price swings. These conditions create both challenges and potential rewards.
Successful participants use volatility as a strategic tool rather than viewing it as purely negative. Understanding these dynamics forms an essential part of any comprehensive approach.
Opportunities Arising from Rapid Price Movements
Substantial price movements enable traders to capitalize on short-term fluctuations. Active participants can potentially generate returns exceeding those in less turbulent assets.
Common trading approaches include buying during dips and selling during rallies. Some trades involve short positions when expecting downward price action.
| Strategy Type | Primary Opportunity | Risk Level | Time Horizon |
|---|---|---|---|
| Momentum Trading | Capture ongoing trends | High | Intraday to several days |
| Mean Reversion | Profit from price corrections | Medium | Hours to days |
| Volatility Arbitrage | Exploit pricing differences | Medium-High | Days to weeks |
| Delta-Neutral Options | Hedge directional risk | Low-Medium | Weeks to months |
Risk Management and Diversification Tactics
Protective measures become critically important when dealing with turbulent conditions. Investors should implement position sizing rules and stop-loss orders.
Diversification tactics include spreading exposure across multiple digital assets. Combining holdings with traditional investments that show low correlation provides additional stability.
These decisions help prevent single adverse price swings from causing significant losses. A disciplined strategy aligns with individual risk tolerance.
Conclusion
Navigating the dynamic landscape of digital finance demands reliable benchmarks that quantify uncertainty and opportunity. These specialized measurement tools transform complex data into actionable insights for informed decisions.
The distinction between forward-looking expectations and historical patterns provides valuable context for assessing current conditions. Methodological innovations address unique challenges like 24/7 trading and evolving liquidity dynamics.
As participation grows and infrastructure expands, these measurement approaches will continue refining our understanding of price movements. They serve as essential components for anyone engaging with this evolving asset class.
Mastering these concepts represents a crucial step toward financial literacy in emerging investment spaces. The value of such frameworks extends across risk management, strategy development, and market sentiment assessment.


No comments yet