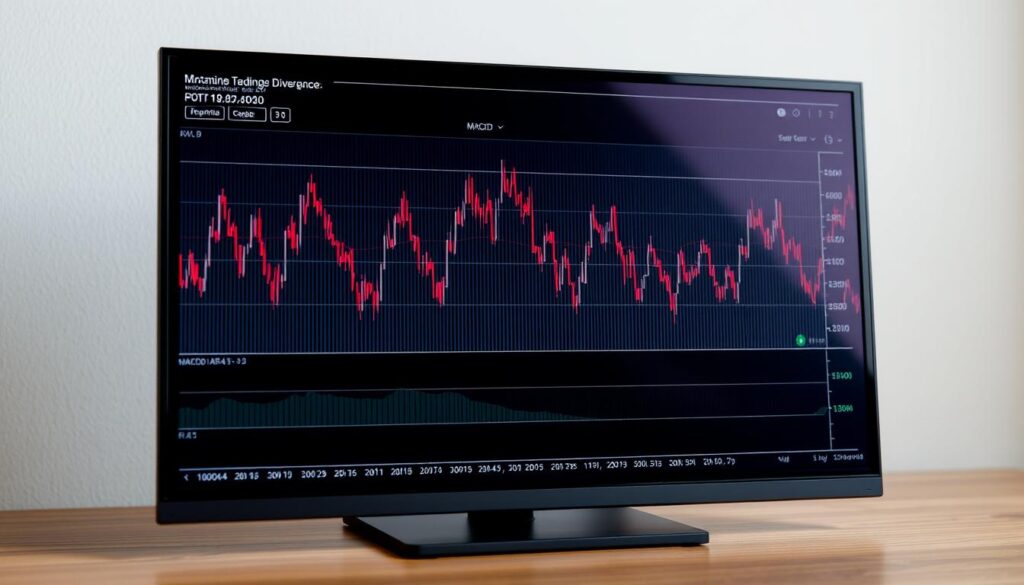
Navigating the world of digital asset markets can feel overwhelming. Many traders struggle to find reliable tools for making smart decisions. The constant price swings create unique challenges that demand effective strategies.
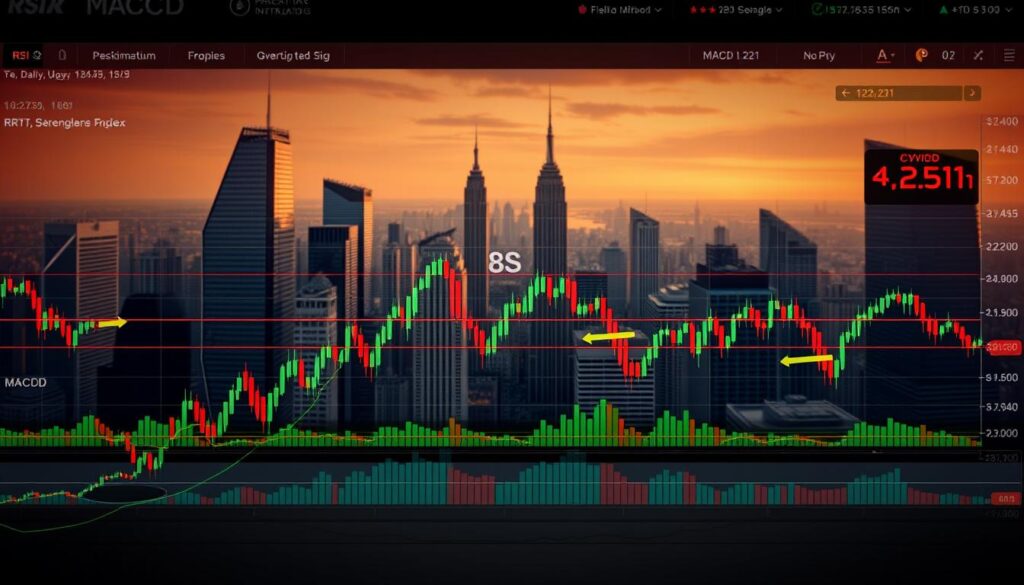
This guide introduces two powerful tools for cryptocurrency analysis. The Relative Strength Index (RSI) helps spot when assets are overbought or oversold. The Moving Average Convergence Divergence (MACD) tracks trend strength and direction.
These indicators work together beautifully. While one measures momentum extremes, the other confirms trend movements. Using them in combination creates a more robust approach to trading.
You’ll learn practical methods for reading these signals. We focus on real-world applications rather than complex theory. Our goal is to give you confidence in your crypto decisions.
Introduction to Crypto Trading and Technical Analysis
Successful trading in digital currencies relies on structured evaluation techniques. Market participants need reliable methods to interpret price movements and make informed decisions.
Overview of Technical Indicators
These analytical tools transform raw market data into actionable insights. They process historical price information and trading volume to identify patterns.
This approach differs significantly from fundamental evaluation methods. While fundamental analysis examines project fundamentals, technical analysis focuses purely on market behavior.
| Analysis Method | Primary Focus | Data Sources | Time Horizon |
|---|---|---|---|
| Technical Analysis | Price patterns and trends | Historical price data, volume | Short to medium term |
| Fundamental Analysis | Project value and potential | Whitepapers, team, adoption | Long term |
| Combined Approach | Comprehensive assessment | Both technical and fundamental data | All timeframes |
Importance in Modern Crypto Markets
The digital asset environment operates 24/7 with significant volatility. These conditions make systematic approaches particularly valuable for traders.
Mathematical indicators provide objective signals that reduce emotional decision-making. They help identify optimal entry and exit points in dynamic market conditions.
As the asset class matures, professional participants increasingly rely on these analytical tools. Proper application significantly improves decision-making consistency.
The Fundamentals of Technical Indicators in Crypto Trading
Objective evaluation methods transform chaotic price movements into actionable insights. These mathematical tools provide structure for market participants seeking consistent results.

Objective Analysis for Informed Decisions
Quantitative tools remove emotional bias from the decision-making process. They generate clear signals based on historical data patterns. This systematic approach helps traders identify optimal entry and exit points.
| Indicator Type | Primary Function | Common Examples | Best Use Case |
|---|---|---|---|
| Momentum Indicators | Measure speed of price changes | RSI, Stochastic | Identifying overbought/oversold conditions |
| Trend Indicators | Determine market direction | Moving Averages, MACD | Confirming trend strength |
| Volatility Indicators | Measure price fluctuation range | Bollinger Bands, ATR | Assessing market stability |
| Volume Indicators | Analyze trading activity | OBV, Volume Profile | Confirming price movements |
Advantages and Limitations
These analytical tools offer standardized frameworks for market assessment. They process vast data instantly, enabling quick reactions to changing conditions.
However, most tools rely on past information, creating inherent delays. Extreme volatility can also generate false signals that require careful interpretation by experienced traders.
Decoding the Relative Strength Index (RSI)
J. Welles Wilder’s 1978 creation revolutionized how traders measure price momentum. This powerful tool compares recent gains against losses over a set period. The result is a clear numerical reading between 0 and 100.

How RSI Measures Overbought and Oversold Levels
The relative strength index identifies when assets reach extreme conditions. Readings above 70 suggest overbought situations where prices may correct. Values below 30 indicate oversold conditions where bounces often occur.
These thresholds help spot potential reversal points. However, strong trends can keep readings at extremes for extended periods. During Bitcoin’s 2021 surge, the strength index stayed above 70 for weeks.
Practical Insights for Entering and Exiting Trades
Traders watch for the oscillator to hit extreme levels before acting. They then confirm these signals with additional analysis. This approach works best in range-bound markets.
The centerline at 50 provides additional momentum context. Values above 50 indicate bullish strength, while readings below suggest bearish pressure. Combining these insights creates a robust framework for decision-making.
Mastering the Moving Average Convergence Divergence (MACD)
Market participants gain significant advantages by mastering this powerful trend-following methodology. The system analyzes relationships between different time frame averages to reveal momentum shifts.

Components of MACD: MACD Line, Signal Line, and Histogram
The core macd line calculates the difference between short and long-term exponential moving averages. This primary component fluctuates around a zero line to indicate momentum direction.
A second signal line smooths the data by applying another average to the main line. The histogram visually displays the gap between these two crucial elements.
| Component | Calculation | Primary Function | Signal Type |
|---|---|---|---|
| MACD Line | 12-period EMA minus 26-period EMA | Measures momentum strength | Bullish/Bearish bias |
| Signal Line | 9-period EMA of MACD Line | Filters noise, confirms signals | Crossover triggers |
| Histogram | MACD Line minus Signal Line | Shows momentum gap | Strength indication |
Identifying Trend Reversals and Continuations
When the macd line crosses above the signal line, it suggests accelerating upward momentum. Conversely, downward crosses indicate strengthening bearish pressure.
The histogram provides visual confirmation of trend strength through bar expansion or contraction. Expanding bars show increasing momentum while shrinking bars warn of potential reversals.
This methodology excels during clear directional movements where consistent signals emerge. Proper interpretation helps traders identify optimal entry and exit points based on momentum confirmation.
Crypto technical indicators RSI MACD for Effective Trading
The effectiveness of momentum measurement varies significantly across trading conditions. Different market environments call for specialized analytical approaches rather than a one-size-fits-all solution.

In trending markets where prices move decisively, the trend-following tool excels. It maintains consistent alignment with the prevailing direction. This helps traders avoid premature exits during strong momentum phases.
During sideways or range-bound conditions, the momentum oscillator proves more valuable. It accurately identifies extreme levels where reversals often occur. These signals work well for short-term trading opportunities.
Day traders typically favor the faster-responding tool for intraday swings. They execute quick trades based on oversold bounces and overbought rejections. The rapid signals capture short-term momentum shifts effectively.
Swing traders generally prefer the trend-confirmation method for larger movements. They use bullish crossovers as entry signals and bearish ones for exits. This aligns their positions with sustained directional momentum.
The most effective approach combines both tools in a complementary framework. Use one to identify potential reversal points and the other to confirm trend support. This integrated strategy reduces false signals and improves trading accuracy.
Integrating Support, Resistance, and Volume Analysis
Building a comprehensive trading strategy requires integrating multiple analytical layers for maximum effectiveness. While momentum tools provide valuable signals, they gain tremendous power when combined with structural price analysis and volume confirmation.
Using Support Resistance Levels for Confirmation
Support resistance levels represent critical zones where buying and selling pressure historically converge. These areas provide objective reference points that validate signals from other analytical methods.
Support levels act as price floors where demand typically overwhelms supply. When momentum readings suggest oversold conditions, these zones become logical entry points. The alignment creates high-probability trading opportunities.
Resistance levels function as price ceilings where selling pressure historically emerges. As momentum tools show overbought conditions near these barriers, traders can identify optimal profit-taking zones. This convergence signals exhausted upward movement.
Volume analysis adds the final confirmation layer by measuring market participation intensity. Increasing volume during breakouts validates genuine momentum rather than false signals. Low volume during consolidation periods often precedes significant price movements.
Traders should establish systematic confirmation requirements before executing trades. Waiting for alignment between momentum signals, price interaction with key levels, and volume confirmation dramatically improves success rates. This multi-factor approach reduces false entries and enhances decision quality.
Step-by-Step Strategy for Using RSI and MACD Together
When two complementary tools work together, they provide stronger confirmation signals. This systematic approach removes guesswork from your decision-making process.
Setting Up Your Chart and Indicator Parameters
Begin by adding both tools to your price chart. Use standard settings that have proven reliable across different market conditions.
| Component | Period Setting | Default Values | Primary Function |
|---|---|---|---|
| RSI | 14-period | 0-100 scale | Momentum extremes detection |
| MACD Line | 12,26 EMA difference | Fluctuates around zero | Trend momentum measurement |
| Signal Line | 9-period EMA | Smooths MACD data | Crossover confirmation |
| Histogram | Automatic calculation | Visual gap display | Momentum strength indicator |
Confirming Signals with Combined Indicators
First, watch for momentum extremes using the oscillator. Readings below 30 suggest potential buying opportunities.
Next, check the trend-following tool for alignment. A bullish crossover supports the initial signal.
Finally, validate with volume and price structure. This multi-layer confirmation creates high-probability setups.
Adapting Indicators to Different Market Conditions
Adapting your analytical approach to current market structure is essential for consistent results. The same tools perform differently across various price environments.
Recognizing whether prices are trending or consolidating helps determine which methodology to emphasize. This flexibility separates successful traders from rigid ones.
Trending Markets vs. Sideways Movements
Strong directional movements favor the trend-following approach. During Bitcoin’s 2021 surge, this tool maintained consistent bullish signals.
It kept traders positioned correctly throughout the sustained upward movement. The momentum oscillator, however, gave premature exit signals.
Range-bound conditions work better with the overbought/oversold detector. Ethereum’s 2022 consolidation showed clear buying opportunities below 30.
Selling zones appeared consistently above 70 within the tight range. The trend-following method struggled with choppy, unreliable signals here.
Volatile periods challenge both approaches. Rapid price swings can generate conflicting readings.
Adding volume analysis or Bollinger Bands helps filter noise during these times. The key is matching your strategy to the current environment.
Practical Applications and Real-World Case Studies
Studying past market behavior offers powerful insights for today’s trading decisions. Historical price movements provide concrete examples of how analytical tools perform in actual conditions.
Learning from Historical Crypto Price Movements
Bitcoin’s 2020-2021 surge demonstrated how trend-following tools excel during strong directional movements. The MACD provided early entry signals that captured the majority of the upward trend.
Meanwhile, the momentum oscillator showed limitations during this period. It remained in overbought territory for months, giving premature exit signals.
Ethereum’s 2022 consolidation period revealed different strengths. The momentum tool accurately identified buying opportunities near support and selling zones near resistance.
The Terra collapse serves as a crucial warning. Both tools generated false signals during the extreme downturn. This highlights the need for additional risk management.
Solana’s 2022 recovery showed the power of combining both methodologies. When momentum extremes aligned with trend confirmation, high-probability entry points emerged.
Traders should maintain journals documenting these patterns. This builds experiential knowledge that improves decision-making over time.
Risk Management and Confirmation Techniques
Protecting your capital forms the foundation of sustainable trading success. While analytical tools provide valuable insights, proper risk management determines long-term profitability.
Smart traders implement systematic rules that safeguard their accounts. These protocols work even when market conditions change unexpectedly.
Incorporating Volume and Momentum into Your Strategy
Position sizing represents your first defense against significant losses. Never risk more than 1-3% of your capital on any single trade.
This approach ensures consecutive losing trades cannot deplete your account. Stop-loss orders should be placed at logical technical levels.
Volume confirmation dramatically improves signal reliability. Look for expanding activity when your tools generate entry signals.
- Multiple timeframe analysis strengthens decisions by aligning momentum across different charts
- Risk-reward ratios of 1:2 or better ensure profitability even with moderate win rates
- Confluence occurs when multiple factors align simultaneously for high-probability setups
Advanced techniques include scaling into positions and using trailing stops. These methods protect gains while allowing winners to run.
Remember that even experienced traders achieve 50-60% win rates. Proper risk management makes the difference between consistent profits and account drawdowns.
Conclusion
Developing a systematic approach to digital asset markets is essential for consistent results. Mastering these powerful analytical tools transforms complex price data into clear signals.
The momentum oscillator excels at spotting potential turning points. The trend-following method confirms the broader directional movement. Together, they create a robust framework for trading decisions.
Successful traders adapt their strategies to current market conditions. They combine these indicators with sound risk management. This disciplined approach separates professionals from amateurs.
Continuous learning through practice builds the intuition needed for crypto success. Your journey to proficiency starts with applying these foundational tools today.


No comments yet