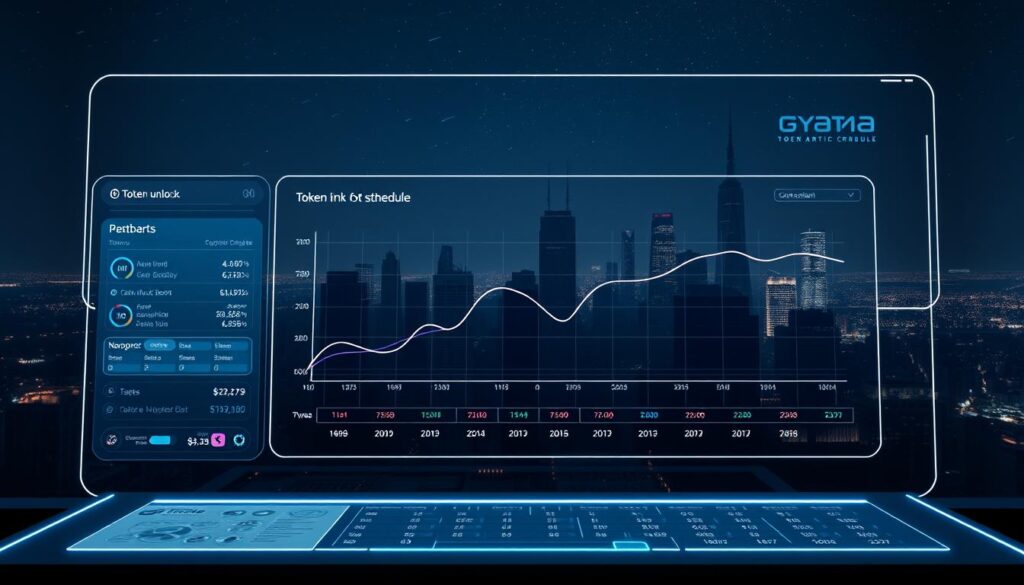
Welcome to a purpose-built page that monitors upcoming releases in real time for U.S. investors and analysts. This hub pulls authoritative on-chain and project-supplied data to show when new supply will hit the market and how it may affect price action.
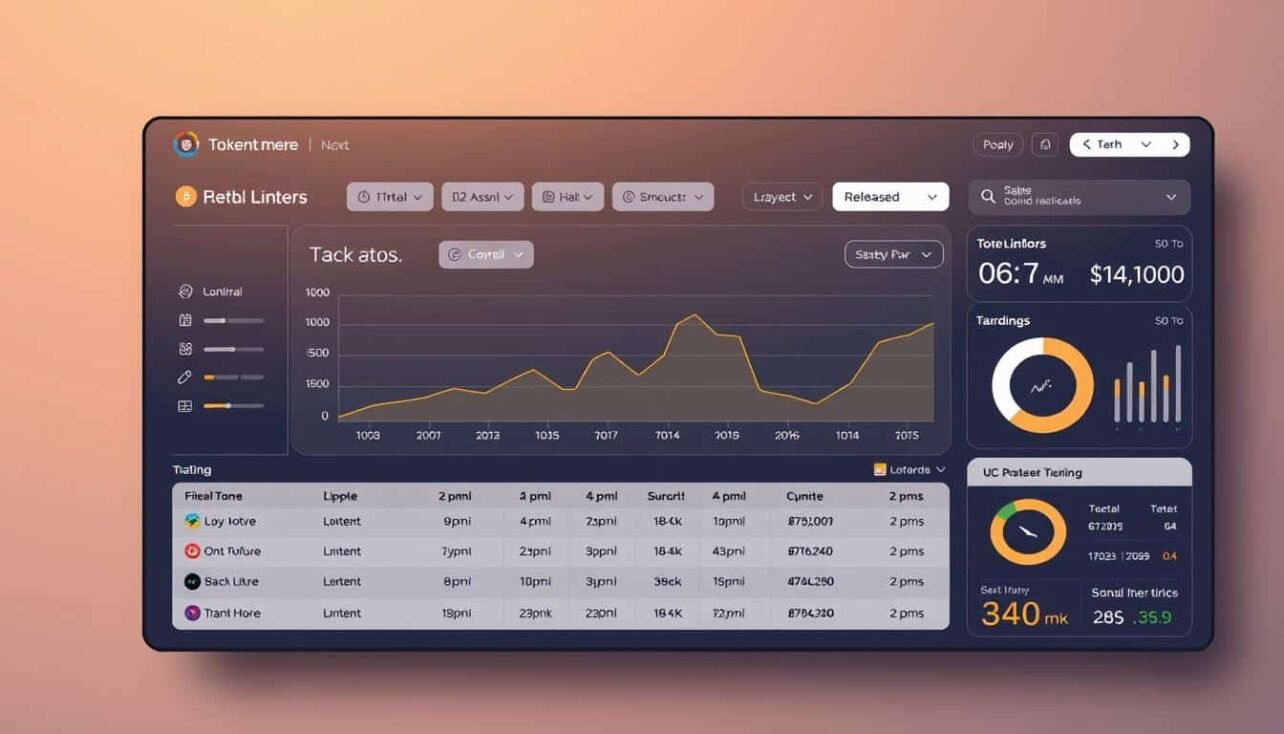
The tool surfaces at-a-glance essentials: next release timers, percent of market cap affected, shifts in circulating supply, and allocation breakdowns. These visuals help users spot potential supply overhangs before they appear in public trading.
Continuously refreshed, the page lists well-known projects and smaller caps alike so both institutional and retail users can plan entries, exits, and hedges with confidence. Below you’ll find clear definitions, live examples, and practical workflows to filter by immediate or weekly windows.
Crypto token unlock schedule tracker for real-time market visibility
Instant market signals show how upcoming releases may shift short-term liquidity and price action.
The interface serves traders, analysts, and project teams who need fast, actionable context. Users scan the immediate time horizon to spot the next events, compare expected changes in circulating supply, and prioritize positions across networks and exchanges.

At-a-glance fields
- Next release: absolute units and USD value with a countdown timer.
- Market impact: percent of market cap and recent price sensitivity cues.
- Supply snapshot: circulating vs total or fully diluted supply for context.
- Distribution: allocations by team, investors, and community to assess sell pressure.
U.S.-focused coverage
Listings show primary exchanges, network context, and page-level performance so U.S. teams can map events to compliance and order-routing workflows.
Live examples include OP, ARB, APT, ENA, IMX, TIA, and SUI with timers, next amounts, impacted percentages, and scheduled dates to help decide if a release is material relative to liquidity.
For a deeper comparison of sites that track vesting and release events, see our roundup of vesting resources.
How our tracker works: token unlock data, vesting logic, and live examples
We map vesting rules to concrete figures so you can see likely supply inflows.
Core concepts explained:
Key mechanics
Start at TGE, when the first on-chain issuance occurs. A cliff period can delay releases for weeks or months.
Linear vesting yields steady, small releases. Non-linear vesting creates uneven tranches that may hit markets abruptly.
Data fields we surface
Every card shows live price, market cap versus fully diluted cap, circulating supply, and the next unlock amount and percent.

Impact cues and examples
Longer vesting periods tend to smooth supply and help price stability. Short, clustered unlocks can pressure liquidity and force tighter risk limits.
| Asset | Next Amount | Next % of Market Cap | Circulating Supply |
|---|---|---|---|
| OP | 32.21M (~$21.14M) | 1.81% | ~1.78B |
| ARB | 93.65M (~$38.62M) | 1.73% | See card |
| APT | 11.30M (~$46.17M) | 1.61% | See card |
| SUI | — (~$154.1M) | 0.50% | See card |
Filtering and transparency
Set the Next Unlock filter to a weekly window to surface time-sensitive events. Our process logs TGE timing, allocation splits, and ongoing unlocks so you can compare entries against recent volume and depth.
Use cases: anticipate token unlocks, manage risk, and act with confidence
Prioritizing events by size and timing makes it easier to protect gains and limit slippage. Start by filtering the page for the nearest events, then sort by percent of market cap and absolute dollars to see what matters most.
Portfolio readiness begins with checking whether recipients are team or investor allocations. Team distributions often signal longer-term selling patterns, while investor releases may hit markets faster.
Practical workflow
- Filter for the next 7 days and flag high-impact entries like OP (1.00% ~$28.1M on 01 Oct 2025) and TIA (2.95% ~$46.7M).
- Review distribution splits to weigh sell behavior and set entry or exit timing.
- Pair the calendar with recent price and volume to judge resilience into added supply.

Market strategy and execution
Map events by network and exchange so trading and risk desks can set alerts and execution routes. For large releases, consider scaling out, tightening stops, or using short-term hedges until price discovery settles.
| Asset | Next % | Approx $ |
|---|---|---|
| OP | 1.00% | $28.1M |
| SUI | 0.50% | $154.1M |
| ARB | 1.24% | $50.9M |
Use this page as a daily hub for standups: scan 7–14 day clusters (OP, ARB, APT, ENA, IMX, TIA, SUI), assign owners, and run pre/post liquidity checks. For more on market effects and analysis best practices, see our piece on market volatility and investor strategy and a guide to analyzing projects before investing.
Conclusion
Monitoring vesting across the full period makes it possible to spot material inflows before markets adjust. Keep the next unlock filter active and check allocation distribution to see which releases involve team or investor balances that may pressure supply.
Use timers and period time windows to align events with recent price action, depth, and cap-relative sizing. That pairing helps you set entries, exits, and hedges with clearer odds.
Combine a clear process—from TGE through subsequent unlocks—with timely data on percent of market cap and next unlock amounts. Treat this page as a daily tool: scan OP, ARB, SUI, TIA, APT, ENA, and IMX to compare schedules across networks and exchanges and act with confidence.
strong, time-aware
FAQ
What is a token unlock schedule tracker and who uses it?
A token unlock schedule tracker is a tool that displays upcoming vesting events, release timelines, and distribution details. Traders, market analysts, fund managers, and project teams use it to monitor next unlocks, vesting period milestones, and potential changes in circulating supply that can affect price and liquidity.
What information can I see at a glance on the tracker?
The dashboard highlights next unlock timers, the amount and percent released, circulating supply, market cap versus fully diluted value, and allocation breakdowns by team, investors, and ecosystem. You’ll also find exchange listings, network status, and page-level performance metrics to gauge market impact quickly.
How does the tracker calculate vesting and release schedules?
The tracker applies vesting logic such as TGE dates, cliff periods, and linear or non-linear release curves. It ingests on-chain and project-disclosed data, then computes upcoming amounts and cadence based on the original distribution terms and any on-chain transactions affecting supply.
What core concepts should I understand to use the tracker effectively?
Key concepts include Token Generation Event (TGE), cliff period timing, linear versus non-linear vesting, allocation categories, and how each affects circulating supply. Understanding these helps interpret how big unlocks will influence liquidity and short-term price moves.
Which projects and live examples are tracked for unlocks?
The platform monitors a range of networks and projects with live timers and percent-of-market-cap indicators, including established layer-2 and layer-1 networks. This provides context for how small-to-large releases may correlate with market activity.
How can I filter the data to find time-sensitive opportunities?
Use filters such as “Next Unlock,” date ranges, allocation type, and percentage thresholds to surface weekly or daily releases. This workflow helps traders spot concentrated supply events or recurring unlock cadences that warrant closer attention.
How does the tracker show the market impact of an unlock?
Impact cues include the unlock amount as a percent of circulating supply, its share of fully diluted supply, historical price reaction to past releases, and linked exchange liquidity. These signals help estimate potential volatility and market absorption needs.
Is the data U.S.-focused or global, and does it include exchange listings?
Coverage emphasizes U.S. market requirements and major exchange listings, while still providing global network details. Each asset page includes exchange pairs, listing dates, and network status to support jurisdictional and market-specific decisions.
How reliable is the data and what is the source process?
The tracker aggregates on-chain records, public tokenomics documents, and exchange disclosures. It prioritizes transparency from Token Generation Events through ongoing unlocks, and flags discrepancies so users can verify details before acting.
How can I use the tracker for portfolio readiness and risk management?
Monitor team and investor vesting timelines to anticipate supply shocks, adjust position sizing ahead of large releases, and plan entries or exits around expected unlocks. Alerts and calendar integrations help maintain readiness for time-sensitive events.
Can the tracker help shape market strategy?
Yes. By correlating upcoming supply changes with historical price action and exchange liquidity, traders and portfolio managers can craft strategies that account for potential sell pressure, short-term volatility, and longer-term dilution effects.


No comments yet