Many people look at price charts to understand the market. But they often miss a key piece of the puzzle. The amount of activity, or volume, tells a deeper story about what is really happening.
This activity acts like fuel for market moves. It shows the strength behind a trend and can signal when a change might be coming. Learning to read these signals is a powerful skill for any market participant.
Our guide will help you understand this crucial relationship. You will learn how to spot high-probability situations and avoid common mistakes. This knowledge provides a real edge in a fast-moving environment.
We cover everything from basic ideas to advanced techniques. This includes a look at key indicators and real-world examples. For a solid foundation, check out this introduction to volume interpretation.
By the end, you will see the market in a new light. You can move beyond just watching price and start understanding the conviction behind each move.
Introduction to Crypto Trading Analysis Volume Patterns
Beyond the visible price fluctuations lies a crucial metric that reveals the true conviction behind market moves. This guide explores how transaction levels provide deeper insights than price charts alone.
Overview of Article Goals
This resource aims to equip participants with practical knowledge about market activity. Readers will learn to interpret transaction data across various timeframes.
The material covers both foundational concepts and advanced applications. It demonstrates how to identify high-probability scenarios while avoiding common errors.
Relevance in Today’s Crypto Markets
Modern digital asset environments feature complex dynamics from diverse participants. Institutional players, individual investors, and automated systems all contribute to these patterns.
Understanding these signals helps detect artificial activity and genuine liquidity. This knowledge becomes particularly valuable during rapid sentiment changes.
| Market Condition | Activity Level | Typical Interpretation |
|---|---|---|
| Strong Trend | High Participation | Genuine conviction behind price movement |
| Weak Trend | Low Participation | Lack of consensus or interest |
| Price Breakout | Spiking Activity | Potential confirmation of new direction |
The following sections will build upon these foundational concepts. They explore specific indicators and real-world applications for different strategies.
Understanding the Role of Volume in Price Movements
The energy behind every market shift comes from the level of participation, not just the price itself. This activity serves as the fundamental driver that creates opportunities for participants.
Volume as the Catalyst for Volatility
Increased participation directly influences market fluctuations. This relationship follows a predictable pattern where higher activity leads to greater price swings.
These conditions then enable directional movement rather than stagnant behavior. The cycle continues as more leverage becomes available, creating additional opportunities.
How Volume Reflects Market Activity
Participation levels show the combined actions of all market players. This includes individual investors, large institutions, and automated systems.
Understanding this collective engagement helps identify periods of high potential. It also signals when conditions may favor staying on the sidelines.
| Activity Level | Price Behavior | Market Condition |
|---|---|---|
| High Participation | Strong directional moves | High opportunity environment |
| Moderate Activity | Mixed directional signals | Selective opportunity period |
| Low Engagement | Sideways or choppy action | Limited profit potential |
This framework helps participants recognize optimal conditions for action. It transforms how one views market dynamics beyond simple price watching.
Key Volume Indicators in Crypto Trading
Moving beyond basic chart reading, specific tools quantify the relationship between activity levels and price action. These instruments help measure the strength behind moves.
They provide clarity during uncertain market conditions. Two of the most powerful tools are the Money Flow Index and On Balance Volume.
Money Flow Index (MFI)
The Money Flow Index acts like a super-charged RSI. It blends price and activity data into a single oscillator.
This indicator ranges from zero to one hundred. Readings above eighty suggest an overbought condition. Levels below twenty point to an oversold state.
Because it includes activity data, the MFI reacts faster to shifts in momentum. It generates more signals than standard oscillators.
On Balance Volume (OBV)
On Balance Volume takes a cumulative approach. It adds activity on up days and subtracts it on down days.
The resulting line shows the net flow of smart money. A key principle is that volume often leads price.
When OBV trends up but the price is flat, it hints at accumulation. This often precedes a significant upward move.
| Indicator | Primary Function | Key Signal |
|---|---|---|
| Money Flow Index (MFI) | Identifies overbought/oversold zones | Readings above 80 or below 20 |
| On Balance Volume (OBV) | Tracks cumulative buying/selling pressure | Divergence with price action |
Advanced Volume Analysis Techniques for Traders
Sophisticated market analysis moves beyond traditional time-based charts to explore volume concentration across price levels. These methods provide a deeper understanding of where genuine market interest exists.
They reveal hidden structures that influence future price behavior. This approach gives participants a significant edge in identifying high-probability scenarios.
Volume Profile and Order Book Analysis
Volume Profile represents a powerful charting method that displays activity horizontally across price points. Instead of showing how much trading occurred during a time period, it shows where it happened at various price levels.
This tool identifies high-volume nodes that act like magnets for future price action. These zones represent areas where the market has shown strong acceptance. They often become reliable support or resistance areas.
Order book analysis complements this by showing real-time supply and demand. It displays pending buy and sell orders at different price points. Large clusters of orders create what traders call “walls” that can stop or accelerate moves.
When historical volume concentration aligns with current order book depth, it creates confluence. These zones offer particularly strong signals for market participants. They represent areas where multiple factors confirm each other.
Understanding both techniques provides a three-dimensional market view. It goes beyond simple price watching to reveal the underlying auction process. This knowledge helps identify the most promising opportunities.
Real-World Examples and Applications of Volume Patterns
Historical events provide the clearest lessons for interpreting market activity. Examining past movements shows how participation levels confirm or deny price action. These case studies turn theory into practical insight.
Case Study: Bitcoin Bull Run
Bitcoin’s impressive climb in early 2021 offers a classic example. The surge from $29,000 to over $64,000 was supported by consistently high activity across exchanges.
This sustained participation validated the upward trend. It signaled genuine interest from both large institutions and individual investors. Platforms like Grayscale reported major inflows, confirming strong accumulation.
Healthy uptrends often show activity expanding on advances and contracting on small pullbacks. This pattern indicated strong buyer conviction and suggested the move had staying power.
Impact of Volume Spikes During Market Crashes
The sharp decline in May 2021 demonstrates the other side of the coin. As prices fell from $58,000 to $30,000, massive activity spikes occurred.
This was not a buying opportunity. The extreme activity reflected panic selling and capitulation. It confirmed the intense selling pressure triggered by negative news.
Ethereum’s 2023 rally similarly showed how strong fundamentals, like DeFi adoption, combined with high participation to create a sustainable advance. Understanding these distinctions is crucial for any market participant.
Exploring Support, Resistance, and Volume Areas
When examining charts, experienced observers notice that some price areas consistently attract heightened market participation. These zones develop significance based on past transaction activity.
Identifying Key Volume Zones
Locating these critical areas requires analyzing how trading activity distributes across different price points. Historical data reveals where substantial numbers of participants previously established positions.
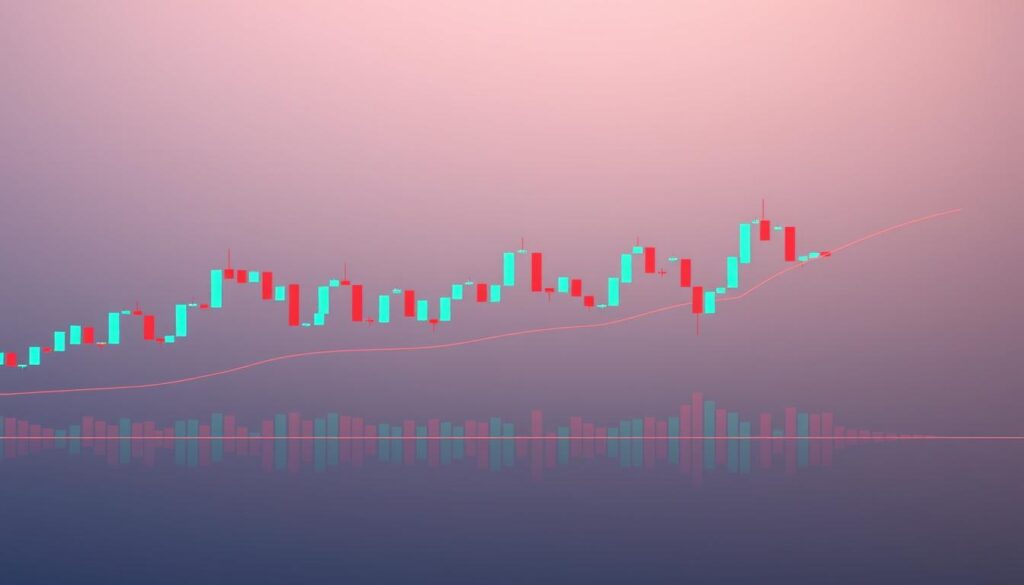
Areas with concentrated historical activity create natural support and resistance levels. When price returns to these zones, previous buyers or sellers often defend their positions.
This creates self-fulfilling patterns where the same price level repeatedly influences market behavior. The concept of volume memory explains why certain zones act like magnets.
Low-volume areas between major zones typically see quick price movement. Price tends to pause or reverse at significant volume concentrations.
Breakouts from major support or resistance with expanding activity suggest genuine trend changes. Those with declining participation often fail.
Volume and Market Sentiment: Liquidity and Trend Confirmation
Liquidity, the lifeblood of any financial environment, is directly observable through transaction data. This metric reveals whether participants can execute orders efficiently without causing major price disruptions.
High activity levels indicate robust conditions where large positions can move smoothly. Thin markets with low participation often lead to significant price impacts from modest trades.
Assessing Liquidity Through Volume
Market depth becomes measurable when you analyze transaction flow. This assessment helps determine if conditions favor active participation or caution.
Strong upward moves gain credibility when supported by expanding activity. This shows new buyers entering with conviction, giving the trend genuine strength.
Conversely, price advances on declining participation often signal false breakouts. These moves lack the necessary fuel for sustainability.
In the crypto space, sentiment becomes quantifiable through these patterns. Enthusiastic activity reflects strong conviction, while low engagement suggests uncertainty.
Comparing current levels to historical averages helps traders gauge commitment. Significant deviations indicate meaningful sentiment shifts.
This understanding allows participants to distinguish between promising opportunities and risky environments. It transforms how traders approach market conditions.
Interpreting Price/Volume Relationships and Trend Reversals
Market movements gain their true meaning when we examine the relationship between participation intensity and directional changes. This connection reveals whether a trend has genuine strength or is approaching exhaustion.
High Volume with Price Increase
When rising prices coincide with expanding transaction levels, it signals strong buyer conviction. This combination represents the ideal scenario for trend continuation.
Each new price high validated by increased participation confirms genuine demand. The movement gains sustainability as more participants join the advance.
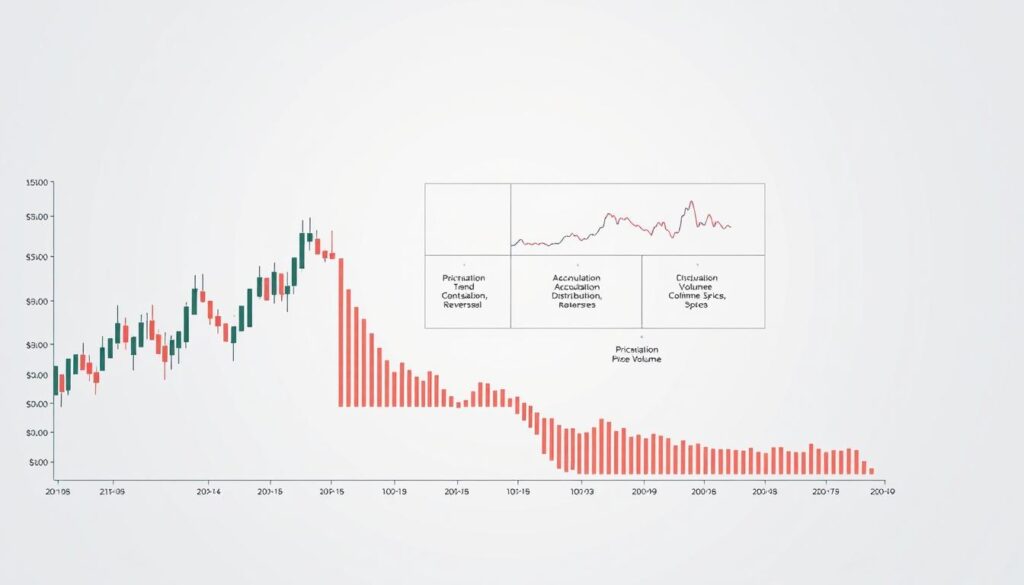
Signals of Price Reversals on Low Volume
Declining participation during price advances often warns of weakening momentum. This divergence suggests fewer buyers support the current trend reversal.
Low transaction levels during declines can paradoxically indicate selling exhaustion. This signal sometimes precedes significant reversal opportunities.
Understanding these price volume dynamics helps anticipate changes before they become obvious. It provides early warning of potential reversal conditions.
Crypto trading analysis volume patterns: Deep Dive
The most reliable technical setups emerge when price action aligns with meaningful market participation. This integration creates a powerful framework for evaluating opportunities.
Many chartists underestimate how transaction data confirms or challenges their findings. Participation levels provide crucial context that pure price observation misses.
Integrating Volume Patterns with Technical Analysis
A systematic approach begins with identifying chart formations and trend directions. Then you examine whether participation data supports these technical signals.
When both elements align, confidence in the setup increases significantly. This confirmation filter helps avoid false breakouts and weak movements.
Divergences between the two elements often provide early warnings. A seemingly strong chart pattern with declining participation suggests underlying weakness.
| Integration Scenario | Chart Signal | Participation Data | Likely Outcome |
|---|---|---|---|
| Strong Confirmation | Breakout above resistance | High transaction levels | Genuine trend change |
| Warning Signal | Bullish pattern formation | Declining activity | Potential failure |
| Accumulation Hint | Sideways movement | Increasing buying pressure | Upward move preparation |
Advanced participants use this multidimensional approach to filter opportunities. It transforms simple chart watching into comprehensive market understanding.
Technical Analysis Tools for Volume Interpretation
Japanese candlestick formations offer a visual window into short-term market psychology when combined with transaction data. These visual tools provide timing precision that basic charts often miss.
Candlestick Patterns and Volume
Candlestick charts display opening, high, low, and closing prices for each period. The color-coded columns show transaction levels for each day.
Green bars indicate rising price days, while red bars show declining periods. This visual system helps identify meaningful patterns quickly.
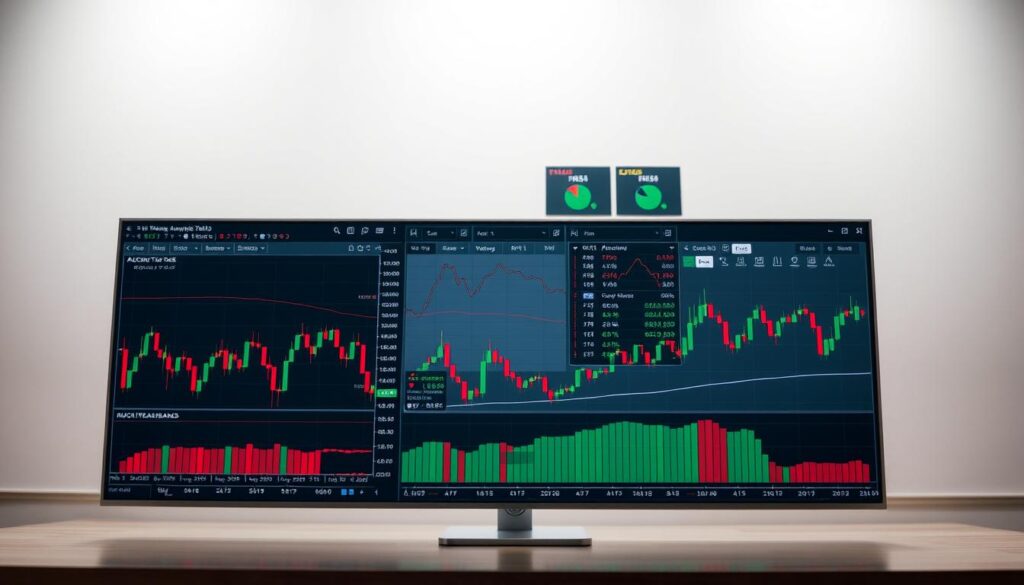
High participation during bullish formations suggests genuine buying pressure. Low activity during similar setups often indicates weak conviction.
Utilizing Other Volume-Based Indicators
Beyond basic metrics, specialized indicators offer deeper insights. The Chaikin A/D Oscillator tracks accumulation and distribution phases.
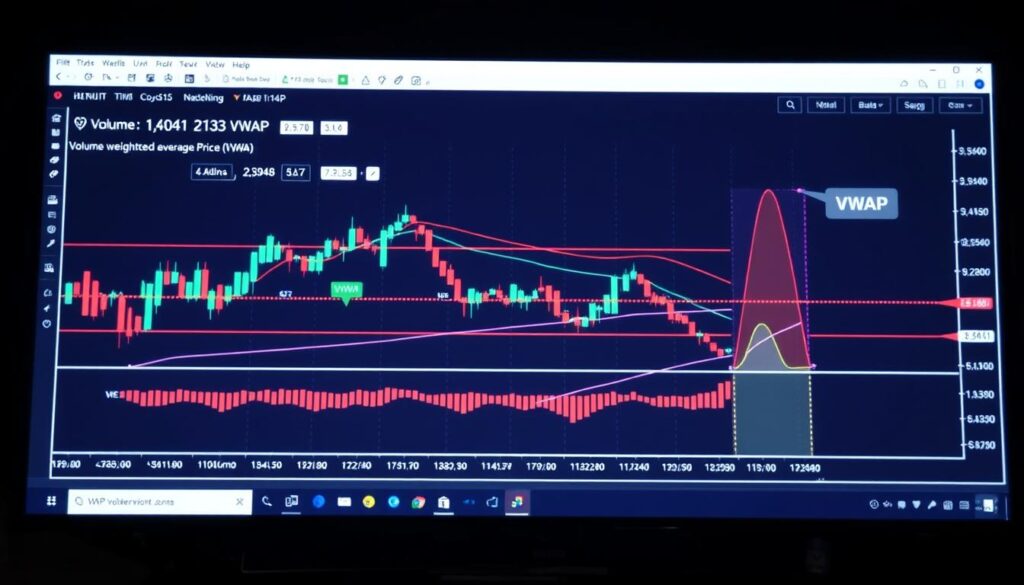
Volume-weighted average price (VWAP) provides institutional-level analysis. These technical indicators confirm whether chart signals have market support.
Each indicator serves as a confirmation tool. They help validate the strength behind each potential signal.
Best Practices for Effective Volume Analysis in Trading Strategies
Building a reliable market approach requires combining transaction data with other confirming signals. This creates a multi-factor system that filters out weak opportunities.
The goal is to build conviction before making a move. Relying on a single metric often leads to false signals.
Combining Volume with Other Technical Indicators
Successful strategies use participation levels as a confirmation tool. They are most powerful when aligned with trend direction and momentum oscillators.
For example, a buy signal is strongest when an asset shows an upward trend and rising activity. This combination suggests genuine buyer interest.
If the trend is positive but activity is declining, it’s wise to wait. This divergence can signal weakening momentum. For deeper insights, explore these chart analysis techniques.
Managing existing positions also benefits from this approach. A holding with strong trend and activity support is a keeper.
If the trend holds but activity turns negative, increased vigilance is needed. Be prepared to exit if the trend also reverses.
Remember, these indicators are short-term tools. They react quickly but can be noisy.
Long-term investors should focus on sustained activity trends. Avoid overemphasizing daily fluctuations.
Common Pitfalls and Misinterpretations in Volume Analysis
Even experienced market participants can fall into traps when interpreting transaction data. The digital asset space presents unique challenges that require careful navigation.
One significant concern involves artificial activity designed to mislead observers. This practice creates false impressions of market interest.
Avoiding Market Manipulation and Wash Trading
Wash trading represents a serious threat to accurate interpretation. The same entity executes both buy and sell orders to inflate numbers.
This manipulation creates misleading signals that can trap participants. Look for unusual spikes without corresponding news or price movements.
Stick to reputable platforms with strong anti-manipulation policies. Regulated exchanges provide more reliable data.
Common errors include:
- Assuming high activity always confirms trend strength
- Ignoring quality in favor of quantity
- Overreacting to short-term fluctuations
Develop critical thinking skills and cross-reference data across multiple sources. Remember that these indicators provide probabilities, not certainties.
Conclusion
Understanding the interplay between participation intensity and directional moves transforms how we perceive market opportunities. This comprehensive article has demonstrated how transaction levels serve as the foundation for interpreting price behavior.
Mastering these concepts provides traders with a significant advantage in the crypto space. The integration of transaction data with technical tools creates a robust methodology for market navigation.
From basic principles to advanced techniques like Volume Profile, this guide offers a complete framework. Real-world examples illustrate how these patterns manifest during actual market conditions.
The knowledge gained here, combined with disciplined risk management, positions participants for improved consistency. Continuous learning remains essential for long-term success in dynamic financial environments.

No comments yet