
Navigating the fast-paced world of digital assets requires more than just luck. It demands a structured framework for understanding price movements. The Wyckoff method provides exactly that.
This time-tested approach to technical analysis was developed over a century ago. It remains highly relevant for decoding modern market behavior.
The core idea is to identify when large players, often called “smart money,” are quietly building positions. By observing price action and volume, you can spot these phases before major trends begin.
This guide will break down the complete market cycle. You’ll learn how this framework helps traders make more informed decisions. It reduces emotional, impulsive reactions to price swings.
We’ll explore practical strategies for assets like Bitcoin and Ethereum. The goal is to give you actionable insights for your trading journey.
Introduction to the Wyckoff Method in Cryptocurrency Trading
In the early 1900s, a young stock runner named Richard Wyckoff began observing patterns that would revolutionize market analysis. Starting his career at age 15, he later founded his own brokerage firm and The Magazine of Wall Street. His work established him as one of the five titans of technical analysis.
He developed the Wyckoff method as a structured framework for understanding price movements. This approach analyzes the battle between supply and demand in any market. It focuses on identifying when large institutional investors, called “smart money,” are active.

The framework emphasizes direct observation of price action and volume over complex indicators. Traders learn to read trading ranges that reveal strategic accumulation or distribution. This provides clarity on why prices move, not just what they’re doing.
This century-old concept remains highly effective in digital asset markets. The volatility and visible blockchain activity make institutional moves easier to spot. For active traders, mastering this approach reduces impulsive decisions and offers a real edge.
Crypto Wyckoff Accumulation Explained
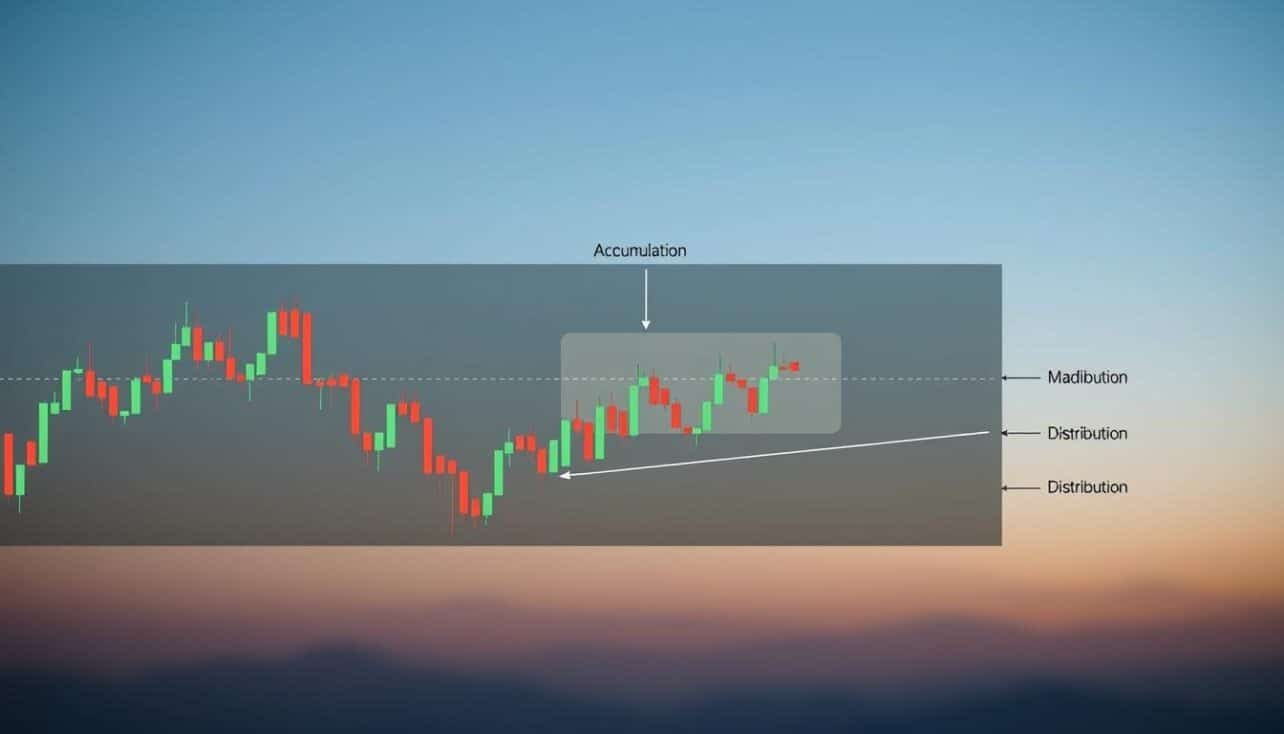
Before any significant market rally, there’s often a quiet period where large investors build their positions discreetly. This accumulation phase represents a strategic buying window where institutional players acquire assets before prices rise.
The action occurs within a defined trading range. Prices bounce between support and resistance levels, creating sideways movement. This consolidation hides the steady buying happening beneath the surface.
 subtly integrated into the chart. The background includes a soft gradient of blues and greens, creating a sense of calm and focus, while gentle lighting illuminates the chart, highlighting the key areas. The mood is analytical and professional, suitable for a financial discussion. The composition should be balanced and engaging, capturing the essence of technical analysis in cryptocurrency trading.")
Richard Wyckoff created the concept of the “composite man” to represent these institutional players. This fictional entity operates strategically to accumulate without alerting the broader market. Their buying doesn’t cause noticeable price increases that would attract attention.
Key characteristics help identify this phase:
- Reduced selling pressure as panic subsides
- Steady buying on lower volume
- Price consolidation forming a horizontal range
The lows within this range often mark selling climaxes. These are points where retail investors capitulate, and smart money absorbs their supply. Bitcoin frequently shows months of this behavior before explosive upward moves.
Recognizing this phase early provides optimal entry opportunities. It helps traders position themselves alongside institutional players. For a detailed guide to Wyckoff accumulation, explore our comprehensive resource.
Understanding Market Cycles and Wyckoff Phases
The core of this framework lies in its breakdown of market behavior into four distinct phases. These stages form a complete cycle that repeats across all timeframes.
By recognizing which phase the market is in, traders can align their strategies with institutional movements.
Accumulation, Markup, Distribution, and Markdown
Accumulation occurs when smart money buys assets at low prices within a consolidation range. This prepares for the next uptrend before most participants notice.
The markup phase follows, where price rises as demand outweighs supply. The public joins the trend, creating momentum.
Next is distribution. Here, institutions sell their positions into strength after an extended rally. They offload to late entrants at peak prices.
The final stage is markdown. Supply overwhelms demand, leading to a downtrend. Retail holders often capitulate at a loss.
Role of the Composite Man and Smart Money
The composite man is a personification of institutional behavior. This concept helps traders think strategically about market movements.
This entity plans ahead and accumulates a sizable position before starting any trend. It uses large transactions to attract public participation at key moments.
Understanding these phases and the composite man’s actions allows you to anticipate moves. You can position yourself alongside smart money for better results.
Identifying Accumulation and Distribution Zones
The framework provides a detailed map of specific events that signal the beginning or end of a major trend. Learning to spot these patterns within a trading range is crucial for timing your moves.
Key Characteristics and Signals
An accumulation zone forms after a downtrend. Key events include Preliminary Support, where initial buying appears. The Selling Climax marks peak panic.
Smart money absorbs supply here. A bounce called the Automatic Rally follows. The Secondary Test confirms lows on lower volume.
A Spring may break support briefly to trap sellers. A Sign of Strength then breaks the range upward.
The distribution phase shows opposite patterns. Look for a Buying Climax with high volume at peak prices.
Preliminary Supply hints at early selling. An Automatic Reaction pulls prices down. The Sign of Weakness breaks key support.
Watch for these core differences between the two zones:
- Accumulation distribution ends a downtrend; wyckoff distribution ends an uptrend.
- Buying is hidden in accumulation; selling is disguised in distribution.
- Volume expands on breakouts from accumulation but often on breakdowns in distribution.
- The market context defines each phase.
Mastering these signals helps you identify the market‘s true intent. It turns a simple range into a story of accumulation distribution.
Utilizing Volume and Price Analysis for Trading Decisions
One of the most powerful concepts in technical analysis is the relationship between effort and outcome. This law helps trading decisions move beyond simple chart watching.
Effort versus Result in Action
Volume represents the effort or energy expended in the market. Price movement shows the actual result. When high activity pushes price significantly, it confirms the trend.
A critical divergence happens with high volume but minimal price change. This signals exhaustion. It often means large interests are absorbing supply demand quietly.
For instance, an asset can show high activity in a narrow range after a downtrend. This suggests accumulation and a potential reversal. The effort yields no immediate result, hinting at a future move.
Conversely, high activity with stalled progress after a rally indicates distribution. Institutions may be selling into retail demand before a decline.
Your analysis should compare volume bars and price candles. Look for these patterns on different timeframes. They help anticipate major turning points.
Understanding this law lets you see beyond surface action. It reveals where smart money is positioning for the next big shift.
Step-by-Step Guide to Setting Up Your Wyckoff Trade
A structured approach transforms market analysis into actionable trading decisions. This trading strategy helps traders follow a clear five-step process.
First, gauge the overall market trend. Check Bitcoin dominance and total market cap for direction.
Second, pick assets aligned with that trend. Focus on stronger coins during uptrends.
Third, identify a cause like a consolidation range. Its duration suggests the coming price move.
Fourth, judge readiness with key events. Confirm springs or signs of strength.
Fifth, time entries after confirmation. Never jump in too early.
Determining Entry Points with Support and Resistance
For long trades, locate an accumulation range. Wait for a spring below support on low volume.
Enter when prices reclaim that support level. This signals control by large players.
For short setups, find a distribution pattern. Watch for an upthrust above resistance.
Short after a breakdown with lower highs. Always seek confirmation.
Managing Stop-Loss and Trade Exits
Define your risk with precise stop-loss orders. Place stops below spring lows for longs.
For shorts, set stops above the upthrust high. This limits loss if the trade reverses.
Target the range’s opposite boundary first. Then, adjust stops to lock in profits.
Use smart position sizing. Keep risk-reward ratios favorable for consistent results.
Interpreting Wyckoff Trading Signals and Patterns
Accurate interpretation of key signals separates reactive traders from strategic ones. Specific patterns act as a roadmap during each phase of the market cycle.
Effective analysis uses multiple timeframes. Weekly charts show the macro structure. Daily or 4-hour charts are perfect for spotting accumulation or distribution ranges.
Shorter timeframes like 1-hour or 15-minute charts help with precise entries. Three core signals guide your trading decisions:
- Spring: A wick below support that quickly recovers. This final shakeout signals the end of accumulation. Buy on the low-volume test that follows.
- UTAD (Upthrust After Distribution): A false breakout above resistance. It traps late buyers before a markdown. Short after confirmed weakness.
- SOS (Sign of Strength): A high-volume breakout from a range. It confirms the markup phase has begun. This is a chance to add to a position.
After a breakout, watch for a Last Point of Support (LPS). This minor pullback offers a second-chance entry. Always confirm signals with sustained strength in prices.
Context is king. Distinguish real signals from false ones by watching for liquidity hunts and open interest spikes. For a deeper dive into these foundational patterns, review this complete guide to the Wyckoff method.
Risk Management Strategies in Wyckoff Trading
The foundation of a successful trading career isn’t built on finding perfect entries, but on mastering the art of managing risk. This method provides a structured framework for this discipline, not just analysis.
It gives traders clear price levels to set precise orders before entering any trade. This defines tolerance and maximum loss potential upfront.
Defining Trade Validations and Invalidations
Before entering a position, you must define what confirms your thesis and what proves it wrong. Patterns like springs and UTADs offer these objective levels.
Traders should establish clear criteria for both scenarios:
- A break below a spring low invalidates a long setup, signaling continued pressure.
- Surging volume on a breakout validates the start of a markup phase.
- Price holding above a Last Point of Support confirms market strength for a trend continuation.
The next step is execution. Set automatic stop-loss orders at your invalidation point immediately upon entry. This removes emotion from the exit.
Calculate your position size based on the distance to that stop. Risk only a fixed percentage, like 1-2% of your account, per trade.
This disciplined, data-driven approach is the core of a sustainable trading strategy. Patience for high-probability setups improves long-term performance.
Integrating Additional Technical Tools with the Wyckoff Method
While powerful on its own, the Wyckoff framework gains strength when combined with other technical tools. This integrated approach provides a more complete picture of market conditions.
It allows trading decisions to be supported by multiple forms of analysis. The goal is to build greater conviction without losing the method’s core focus.
Combining Patterns with Trend and Indicator Analysis
The wyckoff method explains why price levels matter, not just where they are. Simple support and resistance mark past reactions.
This framework reveals the smart-money actions happening at those zones. It shows accumulation or distribution, adding crucial context.
Other strategies, like those from ICT, also focus on institutional activity. Wyckoff offers a more structured, phase-driven method.
Traditional technical indicators like moving averages or RSI can be useful. However, they typically lag behind actual price movement.
Use them as supplementary confirmation tools, not primary drivers. Your main signals should still come from price and volume patterns.
First, apply trend analysis to confirm the broader direction. Then, look for Wyckoff phases on individual charts.
You can also add fundamental metrics for digital assets. This includes on-chain data and sentiment indicators.
The most effective approach uses this framework as the primary lens. Selectively add other tools that provide non-redundant confirmation.
Maintain observational discipline. Avoid cluttering your chart with too many indicators that cause analysis paralysis.
Advanced Techniques for Combining Wyckoff with Broader Market Trends
To move beyond basic setups, one must learn how cycles nest within larger trends. The complete wyckoff method cycle operates simultaneously on different charts.
A weekly chart might show an accumulation distribution phases, while the daily chart displays a wyckoff distribution. This creates powerful, layered context for your trades.
During a markup phase, price often consolidates. This creates a re-accumulation pattern, a mini buying zone before the uptrend resumes.
The same logic applies in downtrends. A pause forms a re-distribution area where remaining supply is sold.
Analyze leaders like Bitcoin first. Their current phase often predicts the broader market direction for altcoins. This phase-driven framework explains the full lifecycle of a move.
Your strategies should adapt to conditions. In bull trends, focus on finding these re-accumulation zones. In bear trends, watch for re-distribution.
Develop a multi-layered analytical framework. Confirm a coin’s pattern by checking if the sector leader shows a supporting trend. This alignment increases your conviction for high-probability trades.
Practical Examples and Real-World Application in Crypto Markets
Real-world charts tell stories of institutional strategy playing out in digital markets. Seeing the theory in action transforms abstract concepts into powerful tools for active participants.
This practical look brings the Wyckoff method to life through detailed case studies. We’ll examine specific events in major digital assets.
Case Studies from Bitcoin, Ethereum, and Altcoins
Historical Bitcoin charts show clear accumulation phases. During sideways action, reduced selling pressure and steady buying on lower volume signaled rising demand.
This often hinted at a potential upward move. Multi-month consolidation in Ethereum frequently preceded substantial price rallies after a breakout.
Altcoin examples demonstrate how these principles apply across different market capitalizations. Smaller-cap assets often show more pronounced accumulation and distribution characteristics.
The unique transparency of blockchain technology helps. Traders can monitor large wallet movements that confirm smart money activity.
Tools like “Whale Alert” provide additional context when integrated with phase identification. This aligns with the law of effort versus result in the market.
Learning from both successful and unsuccessful trades sharpens your trading edge. For a complete walkthrough of these real-world applications, see this guide to the Wyckoff method in crypto.
Conclusion
The journey through market cycles is illuminated by a century-old framework that reveals smart money’s footprints. The Wyckoff method provides this clarity, turning chaotic price action into a readable story.
Its power lies in three core laws. The law of supply and demand determines direction. Cause and effect links consolidation size to future moves. The effort versus result law uses volume divergences to spot reversals.
Markets continuously rotate through accumulation distribution phases: markup, distribution, and markdown. Recognizing which phase is active allows traders to align with institutional flow.
Applying this method improves entry timing and reduces impulsive decisions. It builds confidence in volatile crypto environments. Mastery requires patience and deliberate practice.
Remember, no analysis guarantees every win. Combine this framework with strict risk management. Keep studying historical charts to sharpen your trading edge for long-term success.
FAQ
What is the core principle behind the Wyckoff method?
The core principle is understanding the market’s cause and effect. It analyzes how selling pressure and buying pressure create ranges, which then lead to new price trends. The framework teaches traders to read the market’s story through volume and price action.
How can I tell if a chart is in an accumulation or distribution phase?
An accumulation zone forms after a downtrend near a support level, where smart money is quietly buying. A distribution area occurs after an uptrend near resistance, where institutional players are selling. Key signals include specific patterns and a battle between supply and demand within a trading range.
Why is volume so important in this trading strategy?
A> Volume confirms the strength behind price moves, illustrating the “effort versus result” concept. High volume on a breakout from a range shows strong demand. Low volume on a pullback indicates a lack of supply. This analysis helps validate trade setups and gauge market conviction.
What are common entry and exit points using this approach?
A common entry is after a sign of strength, like a breakout from the accumulation range on high volume, often followed by a successful retest. Stop-loss orders are typically placed below key support levels. Exits are planned at predefined resistance areas or when the trend shows weakness.
How does risk management work with this method?
A> Risk management is built into the strategy. Trades are only taken when the setup meets specific validation criteria from the laws. A trade is invalidated if price action contradicts the expected narrative, like failing to hold support. This disciplined framework helps control risk on every position.
Can I use other technical indicators with the Wyckoff framework?
Yes. Many traders combine the core patterns with other tools like moving averages for trend confirmation or momentum indicators. The key is letting the price and volume analysis drive the decision, using additional indicators for secondary confirmation.
Has this method been applied to assets like Bitcoin and Ethereum?
Absolutely. Analysts frequently use this analysis to study market cycles in Bitcoin and Ethereum. The phases of accumulation and distribution are often visible on their charts, helping traders identify potential reversal points after major price swings.
No comments yet