Technical analysis is a powerful method used by traders to forecast price movements. Many successful professionals in the crypto space rely on a straightforward approach. They interpret chart data using basic tools like trend lines and support and resistance levels.
This method often proves more effective than complex indicators. It helps cut through the noise of daily market fluctuations. As Bill Clinton once noted, it’s wise to “Follow the trendlines, not the headlines.” This principle is vital for navigating the volatile digital asset market.
This guide introduces you to these foundational concepts. We will explore how simple lines on a graph can reveal powerful insights. You will learn to identify the direction of price action and anticipate potential shifts.
Our goal is to provide practical knowledge for making informed trading decisions. Whether you are new to this analysis or looking to refine your skills, this information is for you. Understanding these core principles is an invaluable skill for any trader.
Introduction to Crypto Chart Analysis Techniques
This guide will walk you through the core techniques of interpreting price movements on a graph. You will learn to identify key patterns and make informed decisions.
Mastering these skills provides a solid foundation for any market participant. It turns complex information into clear, actionable insights.
What to Expect in This Guide
Our step-by-step approach focuses on practical application. We cover drawing and reading essential graphical tools.
You will discover how to spot support and resistance areas. This knowledge helps pinpoint optimal entry and exit points for your positions.
Some professionals prefer a clean view with minimal clutter. We emphasize that powerful trading strategies can be built using basic elements.
The Importance of Technical Analysis
Technical analysis offers an objective framework. It relies on historical data to forecast potential future movements.
This method helps traders base choices on facts, not emotions. While indicators can add depth, the core skill lies in reading the price action itself.
Every investor develops a unique system over time. The goal is to find an approach that fits your individual style.
| Analysis Approach | Primary Focus | Best For |
|---|---|---|
| Price Action | Raw price movement and patterns | Traders seeking a clean, direct method |
| Indicator-Based | Mathematical calculations on price data | Those who prefer additional confirmation signals |
| Hybrid | Combining price action with select indicators | Versatile traders adapting to different market conditions |
The Basics of Trend Lines in Trading
At the heart of every successful trading strategy lies the ability to accurately interpret directional patterns. These visual guides help traders identify the dominant forces shaping market behavior.
Defining Trend Lines
Trend lines are straight lines drawn on price graphs that connect consecutive swing highs or swing lows. They visually represent the direction and strength of market movement over time.
This tool helps identify whether an asset moves in an upward, downward, or sideways pattern. The fundamental purpose is to provide directional clarity for making informed decisions.

Rules for Drawing Effective Trend Lines
Drawing trend lines correctly requires following three essential rules. First, a valid trend line must connect at least two swing points. Additional touches strengthen its validity.
The second rule states that lines drawn should never cut through candle bodies or wicks. This ensures the line’s predictive reliability remains intact.
Third, trend lines must be based exclusively on closed candles. This confirms that analysis uses confirmed data points rather than forming price action.
| Trend Line Type | Connection Points | Market Signal | Strength Indicator |
|---|---|---|---|
| Upward | Higher lows | Bullish momentum | Price respects ascending line |
| Downward | Lower highs | Bearish pressure | Price respects descending line |
| Sideways | Parallel highs/lows | Consolidation phase | Price bounces between lines |
Understanding these basics provides traders with a foundational tool for market interpretation. The simplicity makes them accessible while remaining powerful for professional strategies.
Implementing Cryptocurrency Chart Analysis Trend Lines
Moving from theory to practice, this section details the hands-on process of applying trend lines to your trading decisions. We will explore a clear method for drawing them and interpreting the resulting signals.

Step-by-Step Trend Line Analysis
Using an app like Good Crypto simplifies the process. Click the tools icon, select the Trend Line tool, and tap on two significant swing points.
You can then drag the line to fit perfectly. Creating the most logical trend line takes intuition and practice. It is better to use fewer lines for a clearer view of the market.
After drawing, monitor how the price interacts with your line. Watch for bounces or a potential breakout. This observation is the core of the analysis.
Real-World Applications for Traders
Real examples show the power of this tool. The DOT/USD pair formed a clear channel. When the price broke above the upper line, it doubled quickly.
Another great example is SOL/BTC. After multiple touches, the support held strong. The eventual move upward offered a high-probability entry.
Always wait for at least two touches to confirm a line. The best opportunities often come on the third or fourth test. Place your stop-loss order just beyond the line to manage risk.
This approach works across different crypto assets and time frames. It helps traders spot clear trading signals in a dynamic market.
Utilizing Support and Resistance with Trend Lines
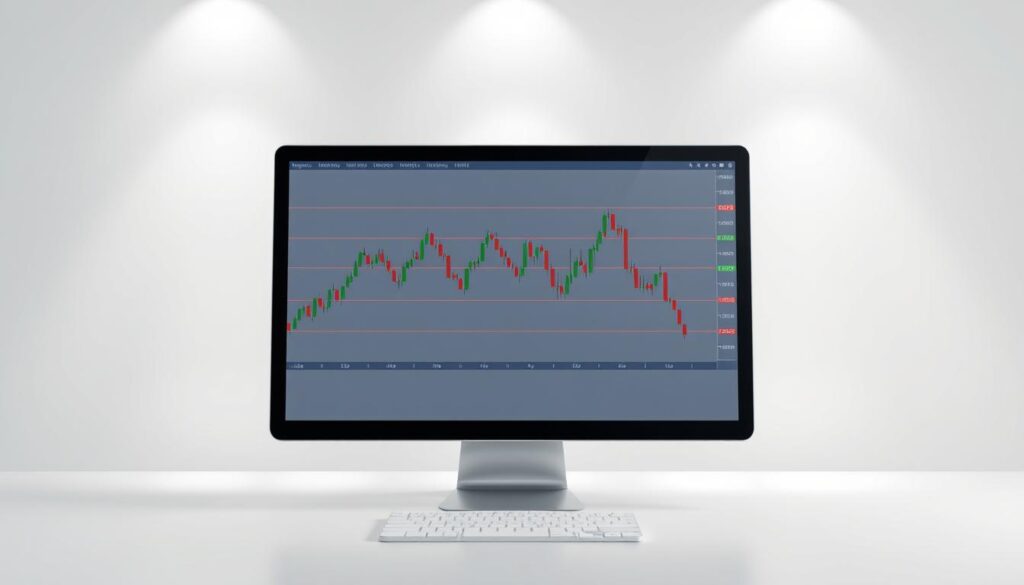
Combining diagonal trend lines with horizontal price zones creates a powerful framework for market analysis. These horizontal areas, known as support and resistance lines, act as critical barriers on a graph. They show where buying and selling pressure has historically been strongest.

Identifying Key Support and Resistance Levels
To find support resistance zones, look for areas where the price has reversed direction multiple times. These levels are not thin lines but wide regions. This is because many traders place orders around the same general area.
For instance, Bitcoin might have a resistance zone between $58,000 and $64,000. The more times the price respects a zone, the stronger that support or resistance level becomes. It represents a collective market memory.
| Level Type | Market Force | Price Behavior | Trader Action |
|---|---|---|---|
| Support | Strong Buying | Price bounces upward | Look for buy opportunities |
| Resistance | Strong Selling | Price pulls back | Consider taking profits |
Transitioning Between Support and Resistance Zones
A key concept is the “flip.” When a resistance level is broken by a strong breakout, it often becomes new support. The opposite is also true. This dynamic change is vital for trading strategies.
This flip shows a shift in market sentiment. Learning to analyze crypto charts for these transitions helps spot major moves. The best signals occur when a trend line meets a key horizontal zone, creating a high-probability area for action.
Crafting a Robust Trading Strategy with Trend Lines
Developing a consistent method for navigating price movements involves combining technical tools with risk management principles. A solid approach helps traders make objective decisions based on market facts.

Optimizing Entry and Exit Points
Effective positioning starts with waiting for confirmation. Look for the third or fourth touch of a validated directional guide before entering.
Combine these touches with additional signals like volume spikes. This increases the probability of successful outcomes. Set take-profit targets at logical resistance areas for long positions.
Integrating Trend Lines with Other Indicators
While using trend lines alone works well, combining them strengthens signals. Moving averages and RSI provide extra confirmation.
This multi-factor approach filters out false breakouts. It creates a more comprehensive view of market conditions.
Example Trades and Risk Management
The SOL/BTC setup demonstrated excellent risk-reward potential. The 7.3:1 ratio meant profits far exceeded the risk.
Always follow the 1% rule for stop-loss placement. This protects your capital from significant losses.
| Strategy Component | Purpose | Implementation |
|---|---|---|
| Breakout Confirmation | Validate directional changes | Wait for price to retest broken line as support |
| Risk Management | Protect portfolio capital | Maximum 1% risk per trade with stop-loss orders |
| Profit Taking | Secure gains systematically | Set targets at next resistance levels |
Conclusion
Building a reliable trading system begins with understanding how markets move and where key decision points form. The techniques covered provide a solid foundation for interpreting price action across various assets.
Mastering how to draw trend lines correctly and identify support resistance zones gives traders an objective framework. This approach helps eliminate emotional reactions to volatility. When a confirmed breakout occurs, it often signals strong momentum moves.
Whether you’re new to crypto markets or refining existing strategies, these tools enhance decision-making. Consistent practice transforms these concepts into profitable habits. The real power lies in combining multiple confirmation signals for higher probability outcomes.
Start applying these methods to develop your own systematic approach. With discipline and patience, you can build a sustainable edge in dynamic market conditions.


No comments yet