The crypto market’s extreme volatility can make timing your investments challenging. When Bitcoin plummets, should you sell to avoid further losses or buy the dip? When prices surge, is it time to take profits or ride the wave higher? The Cryptocurrency Fear and Greed Index offers valuable insights to help answer these questions, serving as a powerful market timing tool when used correctly.
In this comprehensive guide, we’ll explore how to leverage this sentiment indicator to potentially improve your market timing decisions, avoid emotional trading pitfalls, and develop a more disciplined investment approach.
Understanding the Cryptocurrency Fear and Greed Index
The Cryptocurrency Fear and Greed Index ranges from 0 (Extreme Fear) to 100 (Extreme Greed)
The Cryptocurrency Fear and Greed Index (CFGI) is a metric that quantifies market sentiment on a scale from 0 to 100. Developed by Alternative.me in 2018, it was adapted from CNN Money’s traditional market Fear and Greed Index to specifically track sentiment in cryptocurrency markets.
The index assigns numerical values to represent the emotional state of crypto investors:
- 0-24: Extreme Fear – Investors are panicking, often during significant market downturns
- 25-49: Fear – Caution prevails, with negative sentiment dominating
- 50-74: Greed – Optimism is growing, with increasing buying pressure
- 75-100: Extreme Greed – FOMO (fear of missing out) dominates, often near market peaks
The index operates on the principle that extreme fear can indicate buying opportunities (as markets may be oversold), while extreme greed may signal a market correction is coming (as markets may be overbought).
How the Fear and Greed Index is Calculated
The Cryptocurrency Fear and Greed Index analyzes multiple data sources to generate its daily score. Understanding these components helps you better interpret what the index is actually measuring.
| Component | Weight | Description |
| Volatility | 25% | Measures Bitcoin’s current volatility compared to average values of the last 30/90 days. Higher volatility typically indicates fear. |
| Market Momentum/Volume | 25% | Analyzes current trading volumes against 30/90-day averages. High buying volumes in rising markets signal greed. |
| Social Media | 15% | Tracks hashtag frequency and sentiment on Twitter/X. Increased positive mentions often indicate growing greed. |
| Bitcoin Dominance | 10% | Measures Bitcoin’s market share. Rising dominance may indicate fear (flight to safety), while falling dominance can signal greed (altcoin speculation). |
| Google Trends | 10% | Analyzes search queries like “Bitcoin price” or “Bitcoin crash.” Search patterns reveal public interest and concern levels. |
| Surveys | 15% | Polls of crypto market participants (currently paused in the index calculation). |
By combining these data points, the index creates a holistic view of market sentiment that goes beyond price action alone. This multi-faceted approach helps capture the emotional state driving the market.
Extreme Fear: Identifying Potential Buying Opportunities
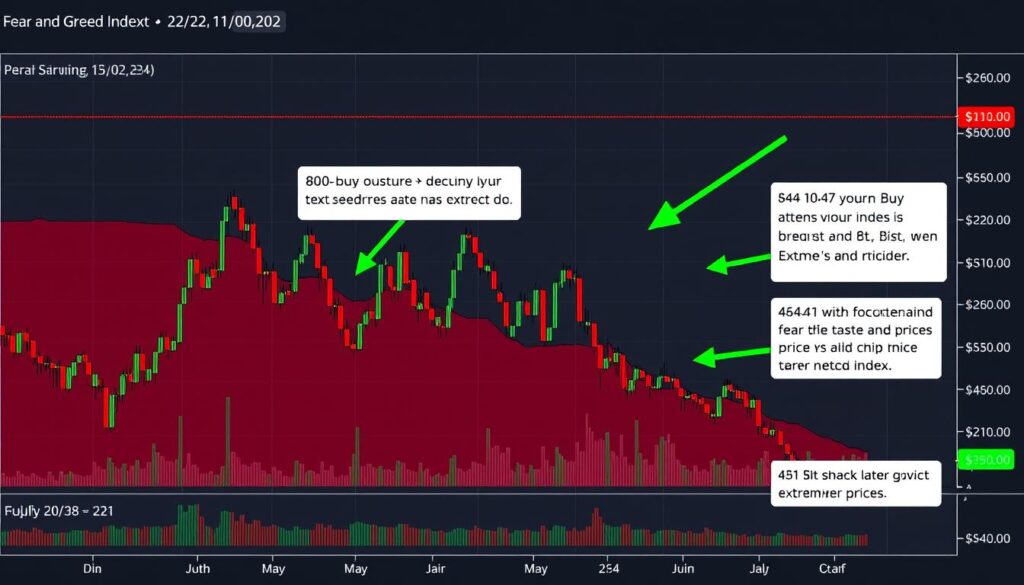
When the Cryptocurrency Fear and Greed Index falls below 25 into the “Extreme Fear” zone, it often signals excessive pessimism in the market. Historically, these periods have presented compelling buying opportunities for long-term investors.
Warren Buffett’s Wisdom: “Be fearful when others are greedy, and greedy when others are fearful.” This contrarian approach is particularly relevant in cryptocurrency markets, where emotional trading can create significant price dislocations.
Case Study: March 2020 COVID Crash
In March 2020, as COVID-19 lockdowns began, the Crypto Fear and Greed Index plunged to 10 (Extreme Fear). Bitcoin crashed to around $4,000, losing over 50% of its value in days.
Investors who recognized this extreme fear as a buying opportunity and purchased Bitcoin saw their investment grow by over 1,400% within a year as BTC reached $64,000 by April 2021.
This case demonstrates how extreme fear readings can precede significant market recoveries, especially when the fear is driven by external factors rather than fundamental cryptocurrency issues.
Strategies for Extreme Fear Periods
- Dollar-Cost Averaging (DCA) – Increase your regular purchase amounts during extreme fear periods
- Set Fear-Based Buy Orders – Create automated purchases that trigger when the index drops below certain thresholds
- Focus on Blue-Chip Cryptos – During extreme fear, prioritize established cryptocurrencies like Bitcoin and Ethereum
- Maintain Cash Reserves – Always keep some capital available to deploy during extreme fear periods
Extreme Greed: Recognizing Potential Sell Signals
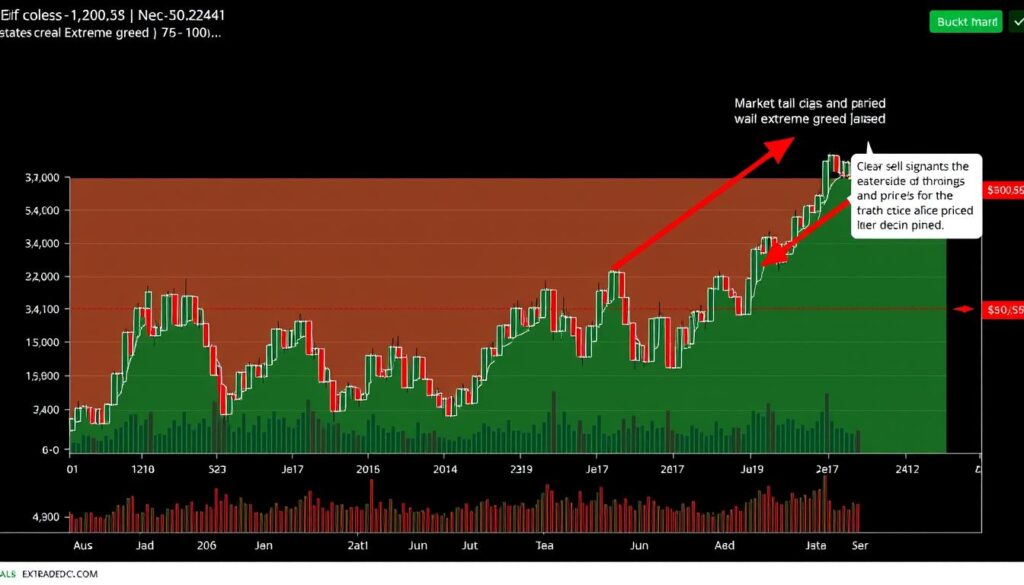
When the index climbs above 75 into the “Extreme Greed” territory, it often indicates excessive optimism and potential market frothiness. These periods frequently precede market corrections or more substantial downturns.
Case Study: 2021 Bull Market Peak
In November 2021, as Bitcoin reached its all-time high near $69,000, the Fear and Greed Index registered readings above 80 (Extreme Greed). Social media was flooded with price predictions of $100,000+ by year-end.
This extreme optimism coincided almost perfectly with the market top. In the following months, Bitcoin lost over 70% of its value, entering a prolonged bear market.
Investors who recognized the extreme greed signal and took partial profits were able to preserve capital and create buying opportunities during the subsequent downturn.
Strategies for Extreme Greed Periods
- Take Partial Profits – Consider selling a percentage of your holdings when extreme greed persists 🚨
- Increase Stablecoin Allocations – Convert some crypto to stablecoins to maintain buying power for future dips
- Tighten Stop-Loss Orders – Protect gains by setting closer stop-losses during extreme greed periods
- Avoid FOMO Purchases – Resist the urge to buy cryptocurrencies making parabolic moves during extreme greed
Navigating the Neutral Zone (25-74)
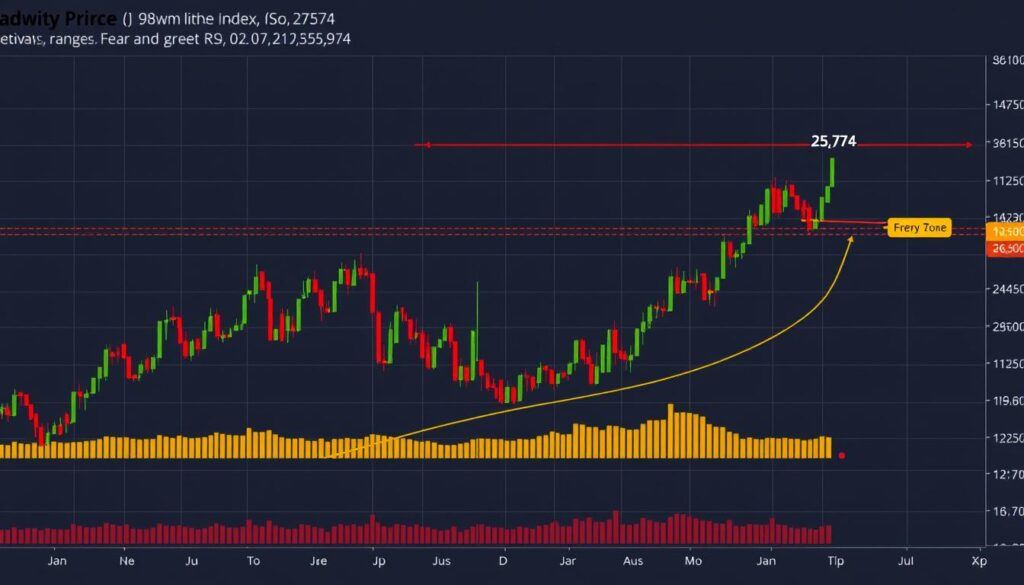
While extreme readings often receive the most attention, the index spends most of its time in the middle range (25-74). These periods require more nuanced strategies that combine the Fear and Greed Index with other technical indicators.
Strategies for the Neutral Zone
Fear Range (25-49)
- Gradually increase positions on dips
- Focus on projects with strong fundamentals
- Look for divergence between price and sentiment
- Maintain regular DCA schedule
Greed Range (50-74)
- Consider taking small profits on significant gains
- Avoid chasing pumping altcoins
- Rebalance portfolio if allocations have shifted
- Continue DCA but consider reducing amounts
During neutral periods, the trend direction becomes more important than the absolute index value. Watch for sustained movements toward either extreme, as these can provide early signals of shifting market sentiment.
Backtested Examples: CFGI Performance
To evaluate the effectiveness of the Cryptocurrency Fear and Greed Index as a market timing tool, let’s examine how it performed during key market periods in 2022-2024.
| Date | CFGI Reading | Bitcoin Price | 1-Month Return | 3-Month Return | Signal Accuracy |
| June 2022 | 10 (Extreme Fear) | $17,600 | +21% | -7% | Medium ⚠️ |
| November 2022 | 22 (Extreme Fear) | $15,800 | +2% | +44% | High 🚀 |
| February 2023 | 62 (Greed) | $24,800 | -11% | +5% | Medium ⚠️ |
| March 2023 | 25 (Fear) | $19,600 | +29% | +53% | High 🚀 |
| December 2023 | 73 (Greed) | $42,000 | +2% | +38% | Low 📉 |
| March 2024 | 83 (Extreme Greed) | $68,000 | -12% | -5% | High 🚀 |
The backtest reveals that the Fear and Greed Index has been particularly effective at identifying major market bottoms during extreme fear periods. However, its performance in predicting tops during extreme greed has been more mixed, with some false signals occurring during strong bull markets.
Limitations of the Fear and Greed Index
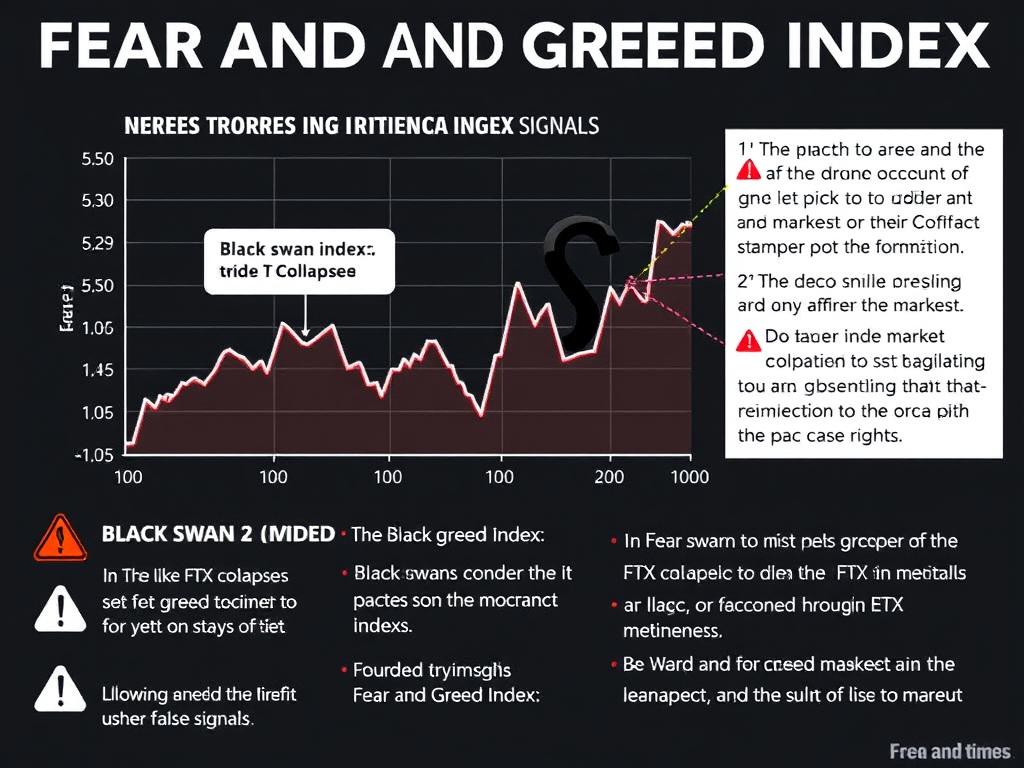
While the Cryptocurrency Fear and Greed Index can be a valuable tool, it’s important to understand its limitations to avoid costly mistakes.
Strengths
- Effectively captures market sentiment
- Combines multiple data sources
- Helps identify potential market extremes
- Simple to interpret for beginners
- Updated daily for timely insights
Limitations
- Lagging indicator (reflects past sentiment)
- Can remain in extreme zones for extended periods
- Doesn’t account for fundamental developments
- Bitcoin-centric (less relevant for altcoins)
- False signals during black swan events
Case Study: 2023 Regional Banking Crisis
During the March 2023 regional banking crisis (Silicon Valley Bank collapse), the Fear and Greed Index initially plunged to extreme fear (22) as markets reacted to the news.
However, Bitcoin unexpectedly rallied over 30% in the following weeks as it was perceived as a hedge against banking system instability. This created a divergence where price action contradicted what the sentiment indicator suggested.
This case highlights how fundamental catalysts can override sentiment indicators, especially during unique market events that change the narrative around cryptocurrency.
Practical Guide: Combining CFGI with Technical Analysis
To maximize the effectiveness of the Cryptocurrency Fear and Greed Index, combine it with complementary technical indicators that can confirm signals and provide additional context.
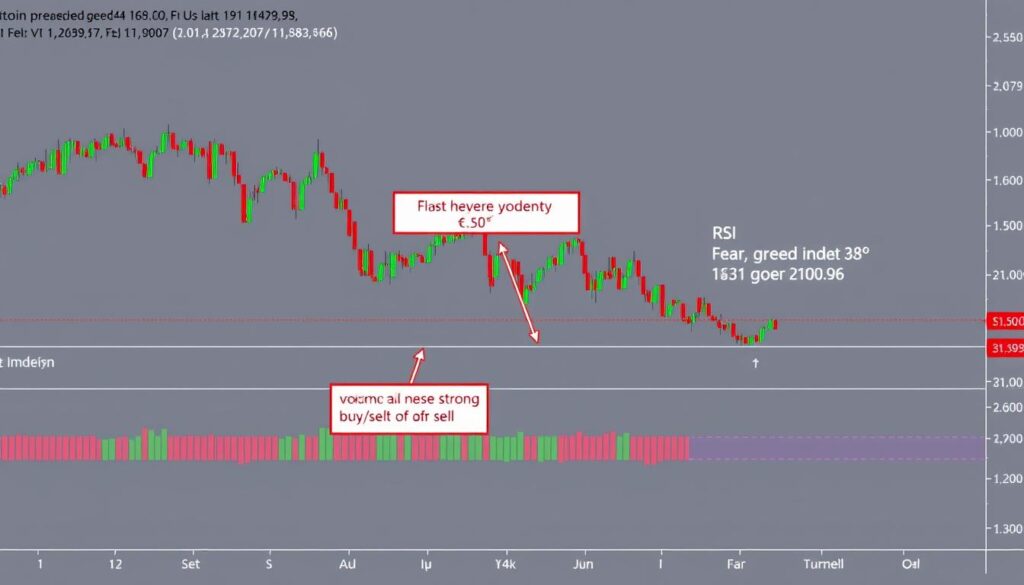
CFGI + RSI Strategy
The Relative Strength Index (RSI) measures the speed and magnitude of price movements, identifying overbought or oversold conditions. When combined with the Fear and Greed Index, it can provide powerful confirmation signals:
| Signal Type | CFGI Reading | RSI Reading | Action to Consider |
| Strong Buy | Below 20 (Extreme Fear) | Below 30 (Oversold) | Accumulate positions 🚀 |
| Moderate Buy | 20-40 (Fear) | 30-40 | Begin scaling in 📈 |
| Neutral | 40-60 | 40-60 | Hold positions |
| Moderate Sell | 60-80 (Greed) | 60-70 | Consider taking partial profits 💰 |
| Strong Sell | Above 80 (Extreme Greed) | Above 70 (Overbought) | Take significant profits 🚨 |
CFGI + Volume Analysis
Volume confirms price movements and can validate signals from the Fear and Greed Index:
- High Volume + Extreme Fear – Often indicates capitulation and potential bottoms
- Declining Volume + Extreme Greed – May signal weakening momentum despite positive sentiment
- Volume Spikes – Sudden increases in volume during sentiment extremes can mark important reversal points
By combining these indicators, you create a more robust system that relies on multiple confirmation signals rather than any single metric.
Current Market Analysis: Today’s CFGI Reading
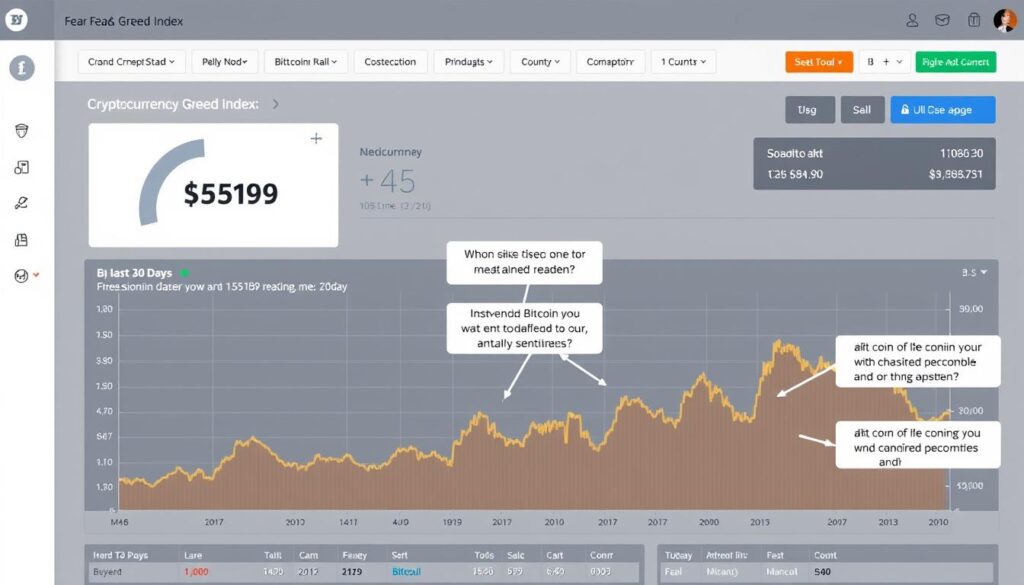
As of publication, the Cryptocurrency Fear and Greed Index stands at 54, indicating a neutral market sentiment with a slight lean toward greed. This reading comes as Bitcoin trades around $63,000, having pulled back from its recent all-time highs.
Current Market Context: The neutral reading suggests a balanced market where neither extreme fear nor excessive optimism is dominating. This often occurs during consolidation phases after significant price movements.
What This Means For Traders
- The neutral reading suggests a potential consolidation phase rather than an immediate major move
- Historical patterns indicate that neutral readings often precede directional moves, making this a time to prepare for potential opportunities
- Consider maintaining regular DCA strategies while preparing capital for possible moves toward extreme readings
- Monitor for shifts toward either extreme, as rapid sentiment changes can precede significant price movements
Remember that current readings should always be viewed in the broader market context, including upcoming regulatory developments, macroeconomic factors, and cryptocurrency-specific events.
CFGI vs. Traditional Market Fear Indicators
How does the Cryptocurrency Fear and Greed Index compare to traditional market sentiment indicators? This comparison helps understand the unique aspects of crypto market psychology.
| Feature | Crypto Fear & Greed Index | VIX (Volatility Index) | Put/Call Ratio |
| Market Coverage | Cryptocurrency markets | S&P 500 (equities) | Options markets |
| Calculation Basis | Multi-factor (social, volume, volatility) | Options pricing | Options volume |
| Update Frequency | Daily | Real-time | Daily |
| Correlation with Price | Moderate-High | Inverse (High VIX = Fear) | Inverse (High Ratio = Fear) |
| Effectiveness for Timing | Good for extremes | Good for market bottoms | Good for short-term reversals |
While traditional indicators like the VIX have decades of historical data to validate their effectiveness, the Cryptocurrency Fear and Greed Index is relatively new. However, it’s specifically designed for crypto markets, which often behave differently from traditional financial markets.
Conclusion: Mastering Market Timing with the Fear and Greed Index
The Cryptocurrency Fear and Greed Index offers valuable insights into market sentiment that can help inform your investment decisions. When used correctly as part of a comprehensive strategy, it can potentially improve your market timing and help you avoid emotional trading pitfalls.

Key takeaways from our analysis:
- Extreme fear readings (0-24) often present potential buying opportunities, especially when confirmed by other indicators
- Extreme greed readings (75-100) may signal times to consider taking profits or reducing exposure
- The index is most effective when combined with technical analysis, fundamental research, and proper risk management
- No single indicator can predict market movements with certainty—always use multiple data points for decision-making
As we look ahead to the remainder of 2024, the Cryptocurrency Fear and Greed Index will likely continue to provide valuable signals during periods of market volatility. By understanding its strengths and limitations, you can incorporate this tool into your broader market analysis framework.
Track Crypto Sentiment in Real-Time
Get daily Fear and Greed Index updates, market analysis, and actionable insights delivered straight to your inbox. Join thousands of smart crypto investors making data-driven decisions.
Frequently Asked Questions
How often is the Cryptocurrency Fear and Greed Index updated?
The index is updated once daily, typically around midnight UTC. This provides a consistent daily reading that can be tracked over time to identify trends in market sentiment.
Can the Fear and Greed Index predict crypto prices?
The index doesn’t directly predict prices but rather measures market sentiment. While extreme readings often correlate with potential reversal points, it should be used as one tool among many rather than a standalone price predictor.
How accurate is the Fear and Greed Index for altcoins?
The index primarily focuses on Bitcoin sentiment, but since Bitcoin often drives overall market direction, it can provide useful insights for the broader crypto market. However, individual altcoins may have their own sentiment cycles that differ from Bitcoin.
What’s the best way to use the Fear and Greed Index for long-term investing?
Long-term investors can use extreme fear readings as potential opportunities to accumulate positions at lower prices. Consider increasing your regular investment amounts during these periods while maintaining your core investment strategy.
Does the Fear and Greed Index work during black swan events?
During unexpected black swan events (like exchange collapses or regulatory crackdowns), the index may provide false signals as these events can fundamentally change market dynamics. Always consider the broader context beyond sentiment alone.

No comments yet