Cryptocurrency futures and derivatives markets have emerged as crucial indicators for price discovery in digital asset markets. These sophisticated financial instruments not only provide trading opportunities but also offer valuable insights into market sentiment, future price movements, and institutional positioning. Understanding how to analyze these markets can give traders and investors a significant edge in predicting price trends before they manifest in spot markets.
In this comprehensive guide, we’ll explore the methodologies, metrics, and tools that professionals use to extract predictive signals from cryptocurrency futures and derivatives markets. Whether you’re an institutional investor managing risk exposure or an individual trader seeking alpha, mastering these analytical approaches will enhance your ability to navigate the volatile world of cryptocurrency markets with greater confidence and precision.
Cryptocurrency futures markets provide valuable price discovery signals for traders and investors
The Role of Futures and Derivatives in Cryptocurrency Price Discovery
Price discovery is the process through which market participants determine the price of an asset through their interactions. In cryptocurrency markets, this process is particularly complex due to market fragmentation, varying liquidity conditions, and the 24/7 trading environment. Futures and derivatives markets play a pivotal role in this process for several key reasons:
Information Efficiency
Futures markets often incorporate new information more rapidly than spot markets. This is because professional traders and institutions with superior information and analysis capabilities tend to express their views first in derivatives markets, where they can employ leverage and take both long and short positions with greater capital efficiency.
Leverage and Capital Efficiency
The ability to trade with leverage means that smaller capital movements in futures markets can signal larger underlying sentiment shifts. When traders are willing to take leveraged positions, it often indicates stronger conviction about future price movements.
Institutional Participation
Regulated futures exchanges like CME attract institutional participants who may avoid spot markets due to regulatory concerns. Their trading activities provide valuable signals about institutional sentiment and positioning.
Market Sentiment Indicators
Derivatives markets offer unique metrics like funding rates, open interest, and basis spreads that provide insights into market sentiment and positioning that aren’t directly observable in spot markets.
Research has consistently shown that futures markets lead price discovery in cryptocurrency markets. Studies by Hu, Hou, and Oxley (2020) found that Bitcoin futures prices Granger-cause spot prices, indicating that futures markets dominate the price discovery process. Similarly, Kapar and Olmo (2019) concluded that CME futures markets contribute significantly to Bitcoin price discovery.
Master Crypto Futures Analysis
Download our comprehensive Cryptocurrency Futures Analysis Framework to start identifying predictive price signals like a professional.
Key Metrics to Analyze in Cryptocurrency Futures and Derivatives Markets
To effectively analyze cryptocurrency futures and derivatives markets for price discovery, you need to monitor several critical metrics. Each provides unique insights into market dynamics and potential price movements:
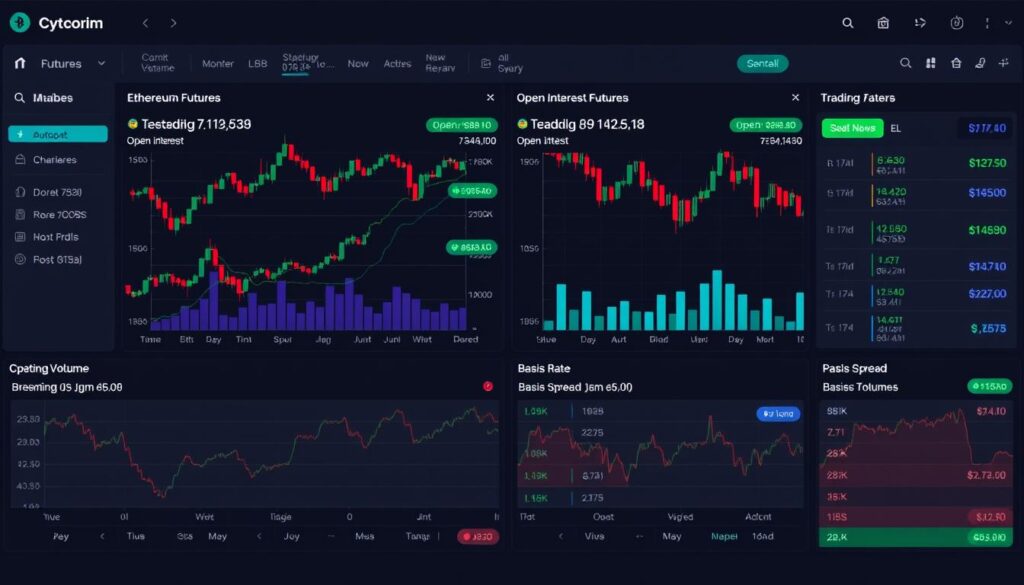
Professional traders monitor multiple futures market metrics to identify potential price movements
Open Interest
Open interest represents the total number of outstanding futures contracts that have not been settled. It’s a crucial indicator of market participation and potential volatility.
How to interpret Open Interest:
- Rising Open Interest + Rising Prices: Indicates strong bullish sentiment with new money entering the market
- Rising Open Interest + Falling Prices: Suggests strong bearish sentiment with new short positions
- Falling Open Interest + Price Movement: May indicate position unwinding and potential trend exhaustion
- Sudden Spikes: Can signal potential volatility or major market events
Trading Volume
Volume represents the total amount of contracts traded during a specific period. It provides insights into the strength of price movements and market liquidity.
High volume accompanying price movements generally confirms the strength of the trend, while price movements on low volume may be less reliable. Volume spikes often occur at key market turning points, making them valuable for identifying potential reversals.
Funding Rates
Perpetual futures contracts use a mechanism called funding rates to ensure the futures price stays close to the index price. These rates are periodic payments exchanged between long and short position holders.
Interpreting Funding Rates:
- Positive Funding Rate: Longs pay shorts, indicating bullish sentiment
- Negative Funding Rate: Shorts pay longs, indicating bearish sentiment
- Extreme Funding Rates: May signal overleveraged positions and potential for sharp reversals
- Funding Rate Divergence: When funding rates diverge from price action, it may indicate a potential trend change
Basis Spreads
The basis is the difference between the futures price and the spot price. This spread provides insights into market expectations and sentiment.
A positive basis (futures trading at a premium to spot) typically indicates bullish sentiment, while a negative basis (futures trading at a discount) suggests bearish sentiment. The steepness of the futures curve across different expiration dates also provides valuable information about longer-term market expectations.
Liquidation Data
Liquidations occur when leveraged positions are forcibly closed due to insufficient margin. Monitoring liquidation data helps identify potential cascade effects and price volatility.
Large liquidation events often lead to exaggerated price movements and can create chain reactions in highly leveraged markets. Clusters of liquidation levels can act as magnets for price, as market makers may push prices toward these levels to trigger liquidations.
| Metric | What It Measures | Bullish Signal | Bearish Signal | Analysis Application |
| Open Interest | Total outstanding contracts | Rising OI with rising price | Rising OI with falling price | Market participation and potential volatility |
| Trading Volume | Contract trading activity | High volume on upward moves | High volume on downward moves | Trend confirmation and liquidity assessment |
| Funding Rates | Market sentiment and positioning | Sustained positive rates | Sustained negative rates | Sentiment analysis and potential reversal points |
| Basis Spread | Futures premium/discount to spot | Strong positive basis | Negative basis | Market expectations and arbitrage opportunities |
| Liquidation Data | Forced position closures | Large short liquidations | Large long liquidations | Volatility prediction and cascade effects |
Comparing Futures and Spot Markets for Price Discovery
Understanding the relationship between futures and spot markets is essential for effective price discovery analysis. These markets often exhibit complex interactions that can provide valuable trading signals when properly interpreted.
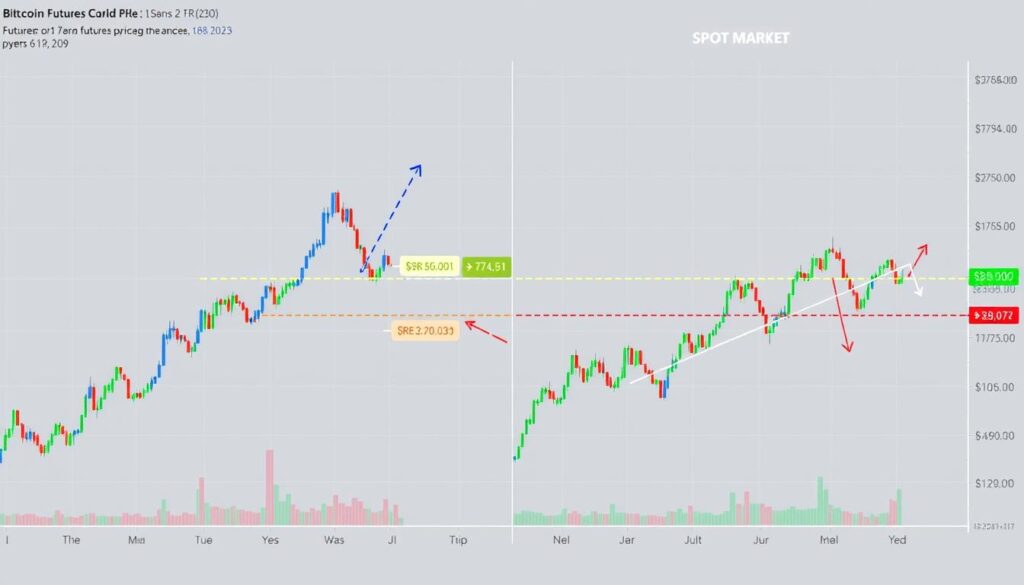
Futures markets often lead spot markets during significant price movements
Convergence and Divergence Patterns
Futures and spot prices typically converge as the contract expiration approaches, but divergences during the contract’s lifetime can provide valuable signals:
Bullish Divergence
When futures prices rise faster than spot prices, it often indicates strong bullish sentiment among professional traders. This pattern frequently precedes upward movements in spot markets as retail traders follow the lead of institutional positioning.
Bearish Divergence
When futures prices fall more rapidly than spot prices, it may signal bearish sentiment among professional traders. Spot markets often follow this downward trajectory as the bearish outlook spreads to retail markets.
Contango
A market condition where futures prices are higher than spot prices. Strong contango (steep futures curve) typically indicates bullish sentiment, though extreme contango can signal an overbought market.
Backwardation
A market condition where futures prices are lower than spot prices. Backwardation often indicates supply constraints or bearish sentiment. Persistent backwardation in cryptocurrency markets is relatively rare and may signal significant bearish positioning.
Lead-Lag Relationships
Research consistently shows that futures markets tend to lead spot markets in price discovery. This lead-lag relationship can be quantified using statistical methods like Granger causality tests and information share analysis.
Studies by Hu, Hou, and Oxley (2020) found that Bitcoin futures prices Granger-cause spot prices, indicating that futures markets dominate the price discovery process. The lead time can vary from minutes to hours depending on market conditions and the specific cryptocurrency.
| Characteristic | Futures Markets | Spot Markets | Implications for Price Discovery |
| Participant Type | Predominantly institutional and professional traders | Mix of retail and institutional | Futures often reflect professional sentiment first |
| Leverage | High (up to 100x on some exchanges) | Limited or none | Amplifies price signals and increases volatility |
| Trading Hours | 24/7 on crypto exchanges; limited on CME | 24/7 | Gap risk on regulated exchanges |
| Shorting Capability | Native and efficient | Limited or requires borrowing | Better price efficiency through easier expression of bearish views |
| Settlement | Cash or physical at expiration | Immediate delivery | Convergence pressure increases near expiration |
| Information Absorption | Typically faster | Typically slower | Futures often lead in incorporating new information |
Arbitrage Mechanisms
Arbitrage activities play a crucial role in maintaining the relationship between futures and spot markets. When divergences become too large, arbitrageurs step in to profit from the price differences, which helps bring markets back into alignment.
The efficiency of arbitrage mechanisms affects how quickly information flows between markets. Factors like exchange withdrawal limits, transaction costs, and funding rates all impact arbitrage efficiency and, consequently, the lead-lag relationship between futures and spot markets.
Stay Updated on Market Dynamics
Subscribe to our weekly Crypto Derivatives Intelligence newsletter for expert analysis of futures-spot relationships and emerging price discovery patterns.
Technical Analysis in Cryptocurrency Derivatives Markets
Technical analysis in derivatives markets incorporates specialized tools and charts that go beyond traditional price action analysis. These approaches help traders identify potential price movements before they manifest in spot markets.
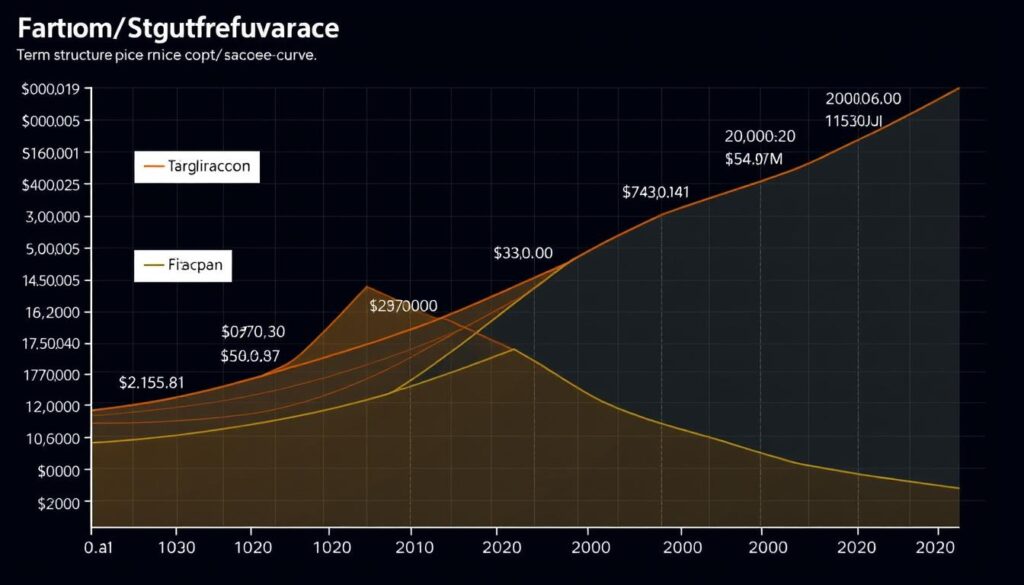
Futures term structure analysis reveals market expectations across different timeframes
Term Structure Analysis
The term structure (or futures curve) plots the prices of futures contracts across different expiration dates. This curve provides insights into market expectations over time.
Key Term Structure Patterns:
- Steep Contango: Futures prices significantly higher than spot, indicating strong bullish sentiment
- Flat Curve: Similar prices across expirations, suggesting market uncertainty
- Backwardation: Futures prices lower than spot, often indicating bearish sentiment or supply constraints
- Humped Curve: Mid-term futures higher than both near and far-term, suggesting mixed market outlook
Changes in the term structure over time can provide early warning signals of shifting market sentiment. For example, a flattening curve after a period of steep contango might indicate waning bullish momentum.
Liquidation Heatmaps
Liquidation heatmaps visualize the concentration of potential liquidation levels across price ranges. These maps help identify price zones where cascade effects might occur.
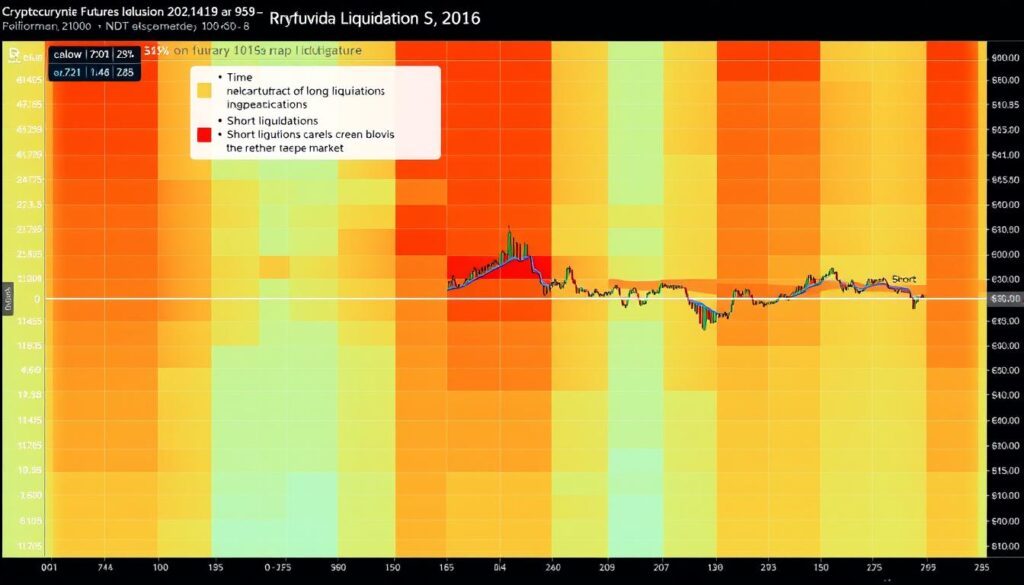
Liquidation heatmaps help identify price levels where cascade effects might occur
Traders can use these heatmaps to identify potential price targets, as markets often move toward large liquidation clusters. Areas with high liquidation density can act as both support and resistance levels, depending on whether they represent long or short liquidations.
Order Book Depth Analysis
Order book depth analysis examines the distribution of buy and sell orders to assess market liquidity and potential price impact of large trades.
Deep order books with balanced buy and sell pressure typically indicate healthy markets with good liquidity. Imbalances in the order book can signal potential price movements, especially when large orders (walls) appear or disappear suddenly.
Cumulative Volume Delta (CVD)
CVD tracks the cumulative difference between buying and selling volume in futures markets. This indicator helps identify underlying buying or selling pressure that may not be immediately apparent in price action.
Divergences between CVD and price can provide early warning signals of potential reversals. For example, if price continues to rise while CVD begins to decline, it may indicate weakening buying pressure despite the upward price movement.
Implied Volatility Analysis
For options markets, implied volatility (IV) analysis helps gauge market expectations of future volatility. The term structure of IV across different expirations and strike prices provides valuable insights.
The volatility smile (IV plotted against strike prices) and volatility term structure (IV plotted against expiration dates) help identify market expectations and potential mispricing. Skew in the volatility smile can indicate directional bias in the market.
Funding Rate Analysis
Beyond basic funding rate monitoring, advanced analysis techniques can extract additional insights:
Advanced Funding Rate Analysis Techniques:
- Funding Rate Divergence: Comparing funding rates across exchanges to identify market inefficiencies
- Funding Rate Momentum: Tracking the rate of change in funding rates to identify acceleration or deceleration in market sentiment
- Funding Rate vs. Price Divergence: Identifying situations where funding rates move contrary to price action, which often precedes reversals
- Cumulative Funding Rate: Tracking the accumulated funding payments over time to identify potential market exhaustion
Extreme funding rates often precede market reversals as they indicate overleveraged positions. Persistent extreme funding rates can signal strong market conviction but also increase the risk of sharp reversals when positions unwind.
Case Studies: Price Discovery in Action
Examining real-world examples helps illustrate how futures and derivatives markets lead price discovery in cryptocurrencies. These case studies demonstrate the practical application of the analytical techniques discussed earlier.
Bitcoin Futures Before and After ETF Approval
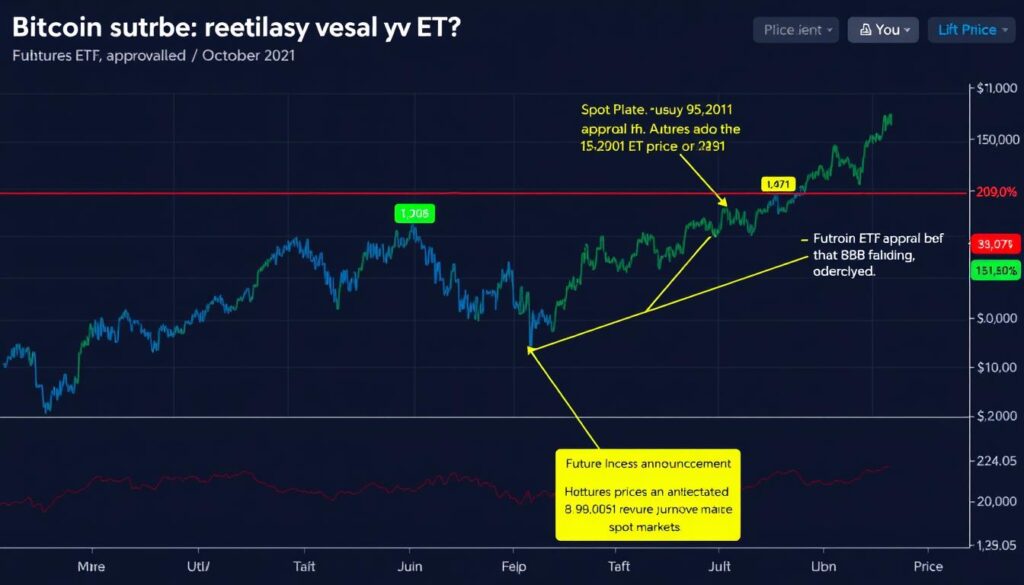
Bitcoin futures signaled market expectations before the ETF approval announcement
The approval of Bitcoin ETFs in October 2021 provides an excellent case study of futures-led price discovery. In the weeks leading up to the approval, several key patterns emerged:
Pre-Approval Signals
- CME Bitcoin futures began trading at an increasing premium to spot prices
- Open interest on regulated futures exchanges rose significantly
- The futures curve steepened, indicating growing bullish sentiment
- Funding rates on perpetual futures remained positive despite price consolidation
Post-Announcement Effects
- Futures premium normalized as spot markets caught up
- Open interest declined as speculative positions unwound
- The futures curve flattened, signaling reduced uncertainty
- Basis trading opportunities emerged as markets realigned
This case demonstrates how futures markets anticipated the ETF approval’s impact before it was fully reflected in spot prices. Traders who monitored these futures signals could position themselves ahead of the spot market movement.
Ethereum Options Activity Around Network Upgrades
Ethereum’s transition to proof-of-stake (the Merge) in September 2022 provides another instructive example of derivatives-led price discovery:
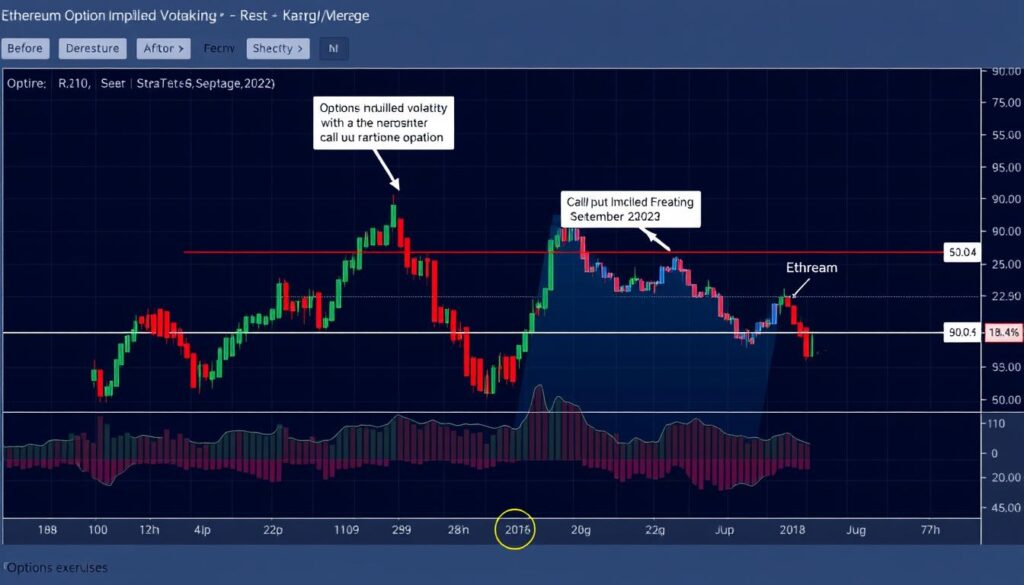
Options markets reflected changing risk perceptions as the Merge approached
Pre-Merge Derivatives Signals
- Implied volatility for options expiring after the Merge increased significantly
- Call options saw higher demand, creating a positively skewed volatility smile
- Futures for post-Merge expiration traded at a premium, creating calendar spreads opportunities
- Funding rates remained positive despite broader market weakness
Market Reaction Patterns
- Volatility collapsed immediately after the successful upgrade
- Futures premium declined as the event risk dissipated
- Options open interest decreased significantly as event-based positions unwound
- New trading opportunities emerged in ETH staking derivatives
This case illustrates how options markets efficiently priced the uncertainty around a major network upgrade and how monitoring these derivatives provided valuable insights into market expectations.
Tesla’s Bitcoin Purchase Impact on Futures Markets
When Tesla announced its $1.5 billion Bitcoin purchase in February 2021, the market reaction provided a clear demonstration of how institutional activity affects futures markets:
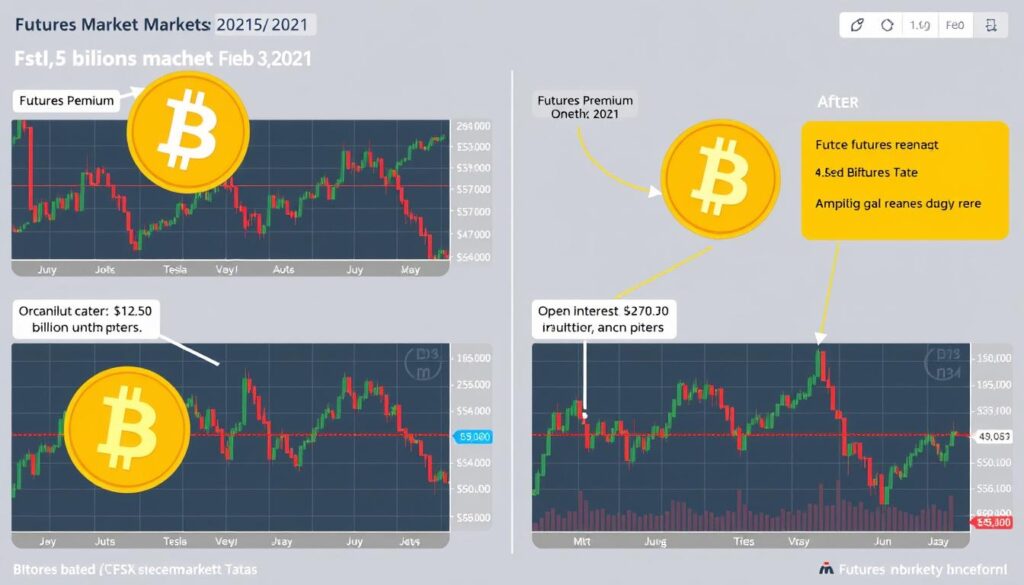
Futures markets amplified the impact of Tesla’s Bitcoin purchase announcement
Initial Market Response
- Futures immediately traded at a significant premium to spot
- Open interest surged as traders positioned for further institutional adoption
- Funding rates spiked to extreme levels, indicating strong bullish sentiment
- The futures curve steepened dramatically across all expirations
Secondary Effects
- Basis trading activity increased as arbitrageurs sought to capture the widening premium
- Options implied volatility rose, particularly for upside strikes
- Liquidation of short positions created a cascade effect, amplifying the price movement
- Spot markets followed futures higher as retail traders reacted to the news
This example shows how futures markets can both lead and amplify price discovery during significant market events. The exaggerated response in derivatives markets provided early signals about the magnitude of the market’s reaction to institutional adoption.
Deepen Your Analysis Skills
Access our complete library of cryptocurrency derivatives case studies, including detailed analysis of major market events and their impact on price discovery.
Risks and Limitations in Futures-Based Price Discovery
While futures and derivatives markets provide valuable price discovery signals, they also come with specific risks and limitations that analysts must consider:
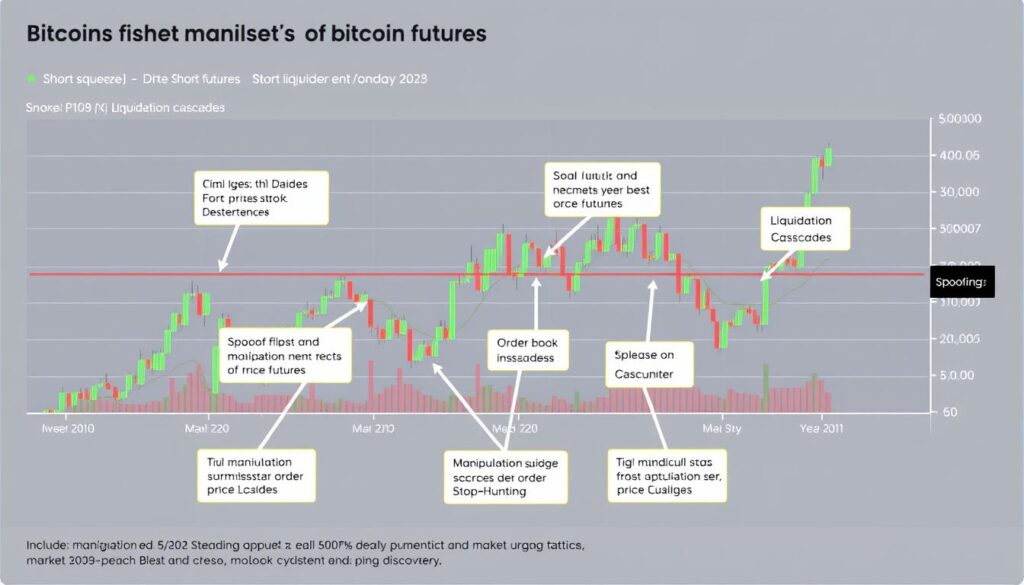
Market manipulation tactics can distort price discovery in futures markets
Manipulation Risks
Short Squeezes and Liquidation Cascades
Highly leveraged futures markets are susceptible to short squeezes and liquidation cascades, where forced position closures create self-reinforcing price movements. These events can temporarily distort price discovery and create false signals.
Large traders may intentionally push prices toward known liquidation levels to trigger these cascades. Monitoring liquidation data and open interest can help identify potential vulnerability to these events.
Spoofing and Order Book Manipulation
Futures markets can be vulnerable to spoofing, where traders place large orders they don’t intend to execute to create false impressions of buying or selling pressure. This manipulation can distort price discovery signals.
Advanced order book analysis techniques, including tracking order placement and cancellation patterns, can help identify potential spoofing activity.
Liquidity Considerations
Liquidity Gaps
Futures markets may experience liquidity gaps, especially during volatile periods or around major news events. These gaps can lead to price dislocations that don’t accurately reflect fundamental value.
Monitoring order book depth and trading volume across multiple exchanges can help identify potential liquidity issues before they impact price discovery.
Exchange-Specific Factors
Different futures exchanges have varying liquidity profiles, user demographics, and trading mechanisms. These differences can lead to exchange-specific price discovery patterns that may not generalize across the market.
Cross-exchange analysis helps identify which venues are leading price discovery at different times and under different market conditions.
Regulatory Impacts
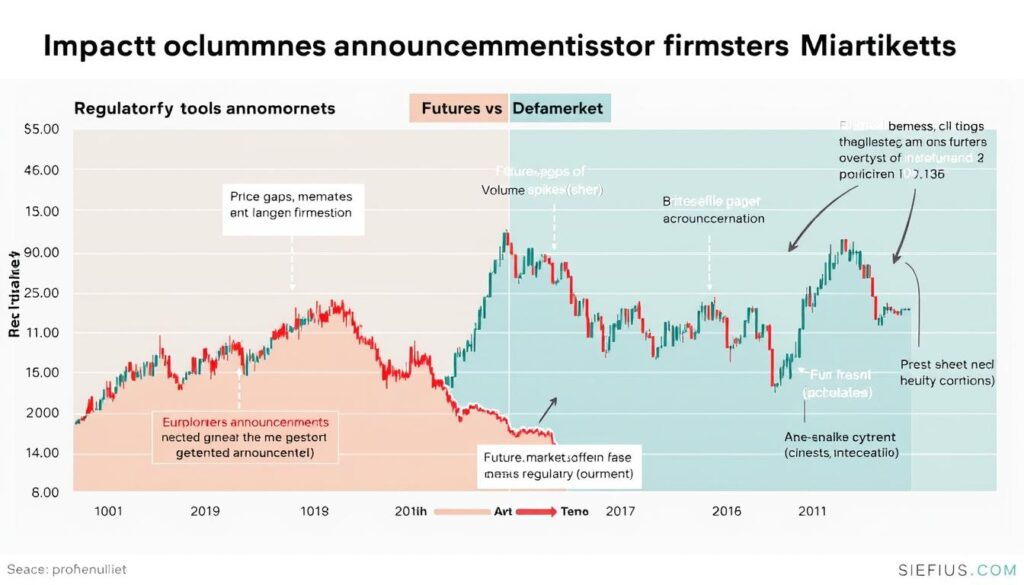
Regulatory developments can create significant dislocations between futures and spot markets
Regulatory Arbitrage
Different regulatory treatments across jurisdictions can create arbitrage opportunities and price dislocations. For example, restrictions on spot market access in certain countries may drive users to futures markets, affecting the normal price discovery relationship.
Monitoring regulatory developments and their impact on market access can help anticipate shifts in the futures-spot relationship.
Position Limits and Market Controls
Regulated futures exchanges often impose position limits and circuit breakers that can interrupt the price discovery process during extreme market movements. These controls may prevent futures markets from fully reflecting market sentiment during stress periods.
Understanding the specific rules of each exchange helps interpret price action during volatile periods when these controls may be activated.
Model Limitations
Strengths of Futures-Based Analysis
- Captures institutional sentiment
- Provides forward-looking indicators
- Offers unique metrics not available in spot markets
- Allows analysis of leveraged positioning
- Enables quantification of market expectations
Limitations of Futures-Based Analysis
- Can be distorted by leverage effects
- May reflect short-term speculation rather than long-term value
- Subject to manipulation in less liquid markets
- Exchange-specific factors may limit generalizability
- Complex interactions can be difficult to interpret
Understanding these risks and limitations is essential for properly interpreting price discovery signals from futures and derivatives markets. Combining multiple indicators and cross-validating signals across different exchanges and timeframes can help mitigate these challenges.
Tools and Platforms for Cryptocurrency Derivatives Analysis
Effective analysis of cryptocurrency derivatives markets requires specialized tools and platforms. Here’s a comprehensive overview of the most valuable resources for price discovery analysis:
Top Exchanges for Derivatives Data
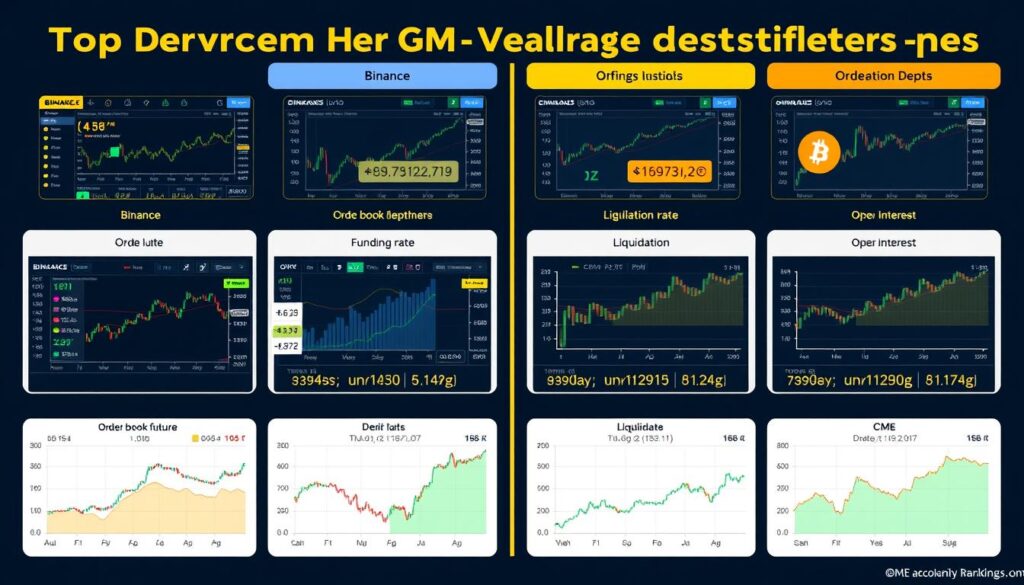
Leading derivatives exchanges offer different data sets and analytical tools
| Exchange | Key Features | Unique Data Offerings | Best For |
| Binance Futures | High liquidity, comprehensive product range | Long/short ratio, top trader positions | Comprehensive market overview, retail sentiment analysis |
| Bybit | User-friendly interface, strong liquidity | Detailed liquidation data, insurance fund metrics | Liquidation analysis, retail trader positioning |
| Deribit | Options focus, institutional grade | Options volume profile, implied volatility surface | Options-based sentiment analysis, volatility forecasting |
| CME Group | Regulated, institutional participation | COT reports, block trade data | Institutional positioning, regulatory-compliant analysis |
| FTX (now defunct) | Innovative products, high liquidity | Prediction markets, volatility products | Alternative data sources, specialized derivatives |
| OKX | Deep liquidity, comprehensive offerings | Taker buy/sell volume ratio, large trader positions | Order flow analysis, market microstructure |
On-Chain Analytics Tools
On-chain data provides valuable context for futures market analysis by revealing underlying network activity and holder behavior:
Glassnode
Offers comprehensive on-chain metrics that can be correlated with futures market activity. Their derivatives dashboard includes exchange flow data, futures market metrics, and options analytics.
Key Features: Futures open interest by exchange, options expiry analysis, exchange inflow/outflow correlation with derivatives activity.
CryptoQuant
Specializes in exchange flow data that helps connect on-chain movements with futures market activity. Their Exchange Whale Ratio metric helps identify when large holders are moving funds to exchanges.
Key Features: Exchange inflow mean (for detecting potential selling pressure), miner position change, stablecoin inflows to exchanges.
Nansen
Provides wallet-level analytics that help identify smart money movements before they impact futures markets. Their Smart Money index tracks the activity of successful traders.
Key Features: Smart money inflows/outflows, exchange deposit tracking, token unlocks and vesting schedules.
Specialized Derivatives Analytics Platforms
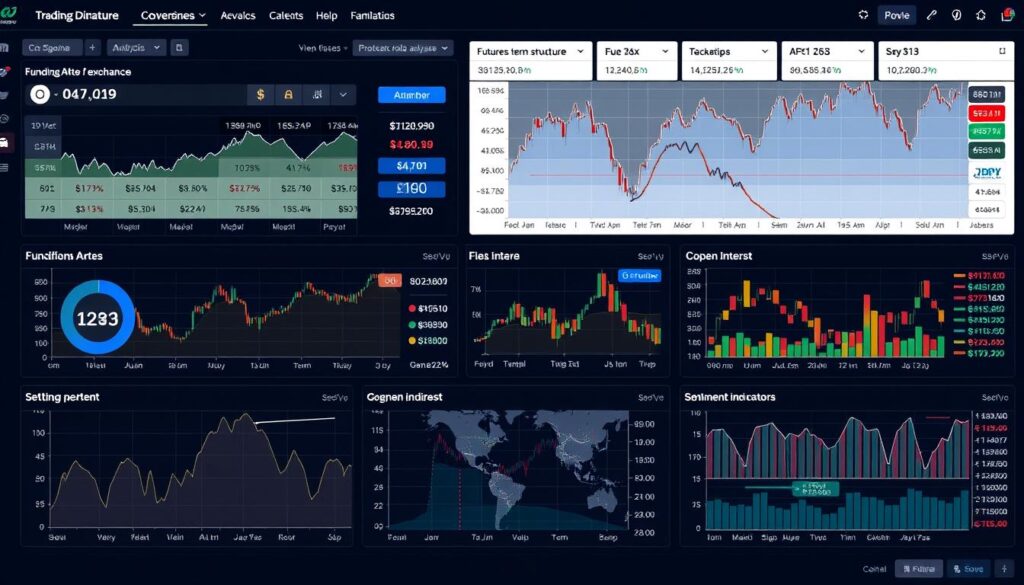
Specialized analytics platforms provide comprehensive derivatives market insights
Coinglass
Aggregates futures and options data across multiple exchanges, providing a comprehensive view of the derivatives market landscape.
Key Features: Cross-exchange open interest, funding rates, liquidation data, long/short ratios, and options expiry analysis.
Laevitas
Specializes in options analytics with detailed visualizations of volatility surfaces, options volume, and open interest by strike price.
Key Features: Options skew analysis, gamma exposure calculations, volatility term structure, and options volume heat maps.
Skew (now part of Coinbase)
Focuses on institutional-grade derivatives analytics with emphasis on volatility metrics and professional trading signals.
Key Features: Volatility indices, term structure analysis, futures basis tracking, and options risk reversal metrics.
DIY Analysis Framework
For traders who prefer to build their own analysis systems, here’s a step-by-step framework for conducting comprehensive derivatives-based price discovery analysis:
Step-by-Step Price Discovery Analysis Framework
- Establish a baseline: Monitor spot prices across major exchanges to establish a reference point
- Track futures premiums: Calculate and monitor the basis spread between futures and spot across multiple expirations
- Analyze open interest trends: Track changes in open interest in conjunction with price movements
- Monitor funding rates: Compare funding rates across exchanges and identify extremes
- Examine liquidation levels: Identify clusters of potential liquidations that could drive price movement
- Analyze order book structure: Look for imbalances in buy/sell pressure and large orders
- Correlate with on-chain data: Connect derivatives activity with underlying blockchain metrics
- Track institutional positioning: Monitor COT reports and block trades on regulated exchanges
- Identify divergences: Look for situations where different indicators provide conflicting signals
- Develop trading hypotheses: Formulate testable hypotheses based on your analysis
This framework can be implemented using data from the exchanges and analytics platforms mentioned above, combined with custom analysis using programming tools like Python with libraries such as pandas, numpy, and matplotlib.
Accelerate Your Analysis
Download our comprehensive Cryptocurrency Derivatives Analysis Toolkit, including custom Python scripts, data connectors, and visualization templates.
Conclusion: Mastering Price Discovery in Cryptocurrency Derivatives Markets
Cryptocurrency futures and derivatives markets have emerged as critical components of the price discovery process in digital asset markets. By providing platforms where sophisticated traders can efficiently express their views with leverage and in both directions, these markets often lead spot prices and offer valuable predictive signals.

Effective derivatives analysis combines multiple metrics and techniques to identify reliable price discovery signals
The key to effective price discovery analysis lies in understanding the complex interplay between futures and spot markets, recognizing the unique signals provided by metrics like open interest, funding rates, and basis spreads, and contextualizing these signals within broader market conditions.
By monitoring term structures, analyzing order book dynamics, tracking liquidation levels, and correlating derivatives activity with on-chain data, traders can develop a comprehensive view of market sentiment and positioning that goes far beyond what can be gleaned from spot market analysis alone.
While futures-based price discovery analysis comes with limitations and risks, including potential manipulation and liquidity concerns, these challenges can be mitigated through careful cross-validation of signals and awareness of market microstructure.
As cryptocurrency markets continue to mature and institutional participation grows, the importance of derivatives markets in the price discovery process will likely increase. Traders who master the analytical techniques outlined in this guide will be well-positioned to identify emerging trends before they manifest in spot markets, potentially gaining a significant edge in their trading strategies.
Take Your Analysis to the Next Level
Join our Crypto Derivatives Masterclass to learn advanced price discovery techniques from professional traders and market analysts.


No comments yet