Financial technology has entered a new era with platforms that merge blockchain intelligence and traditional metrics. Services like Glassnode and Chainalysis now decode complex patterns across Bitcoin, Ethereum, and other networks, transforming raw data into strategic insights. These systems track everything from wallet activity to exchange flows, giving users a competitive edge.
Real-time information from multiple chains powers decision-making for traders and institutions. Nansen’s Smart Alerts, for example, identify emerging opportunities faster than manual research. By combining on-chain behavior with broader economic indicators, these tools reveal trends before they dominate headlines.
Trusted by major exchanges and regulators, modern analytics ecosystems provide more than charts. They map relationships between wallets, measure investor sentiment, and predict liquidity shifts. This level of detail helps users navigate volatility while maintaining compliance in evolving regulatory environments.
Key Takeaways
- Integrated systems blend blockchain data with traditional financial metrics
- Real-time tracking covers multiple networks and asset classes
- Institutional-grade tools are now accessible to retail investors
- Advanced alerts transform raw data into actionable strategies
- Trusted by leading exchanges and financial institutions
Service Overview and Value Proposition
In today’s fast-paced digital asset environment, speed and clarity separate winners from observers. Leading solutions like Glassnode deliver instant visibility into blockchain activity, giving traders the edge to act before trends peak. Real-time tracking of wallet movements and exchange patterns reveals hidden opportunities across Bitcoin, Ethereum, and other top assets.
Discover Real-Time Market Insights
Glassnode transforms raw blockchain data into digestible signals. Its tools map capital shifts between exchanges, track whale activity, and measure network growth. Users spot institutional accumulation or retail sell-offs as they happen, not after price swings occur.
By blending on-chain metrics with traditional indicators like trading volumes, the platform paints a complete picture. This hybrid approach helps investors distinguish between short-term noise and sustainable trends. For example, rising network usage paired with stable coin reserves often signals bullish momentum.
Empowering Informed Trading Decisions
Advanced charting tools simplify complex relationships. Interactive graphs show how miner activity, wallet balances, and derivatives markets interact. Traders test strategies using historical patterns while receiving alerts for emerging opportunities.
Newcomers gain structured guidance through curated metrics and explainers. Veterans use API integrations to build custom crypto dashboards tailored to their strategy. Both groups benefit from tools once exclusive to hedge funds – now accessible with a few clicks.
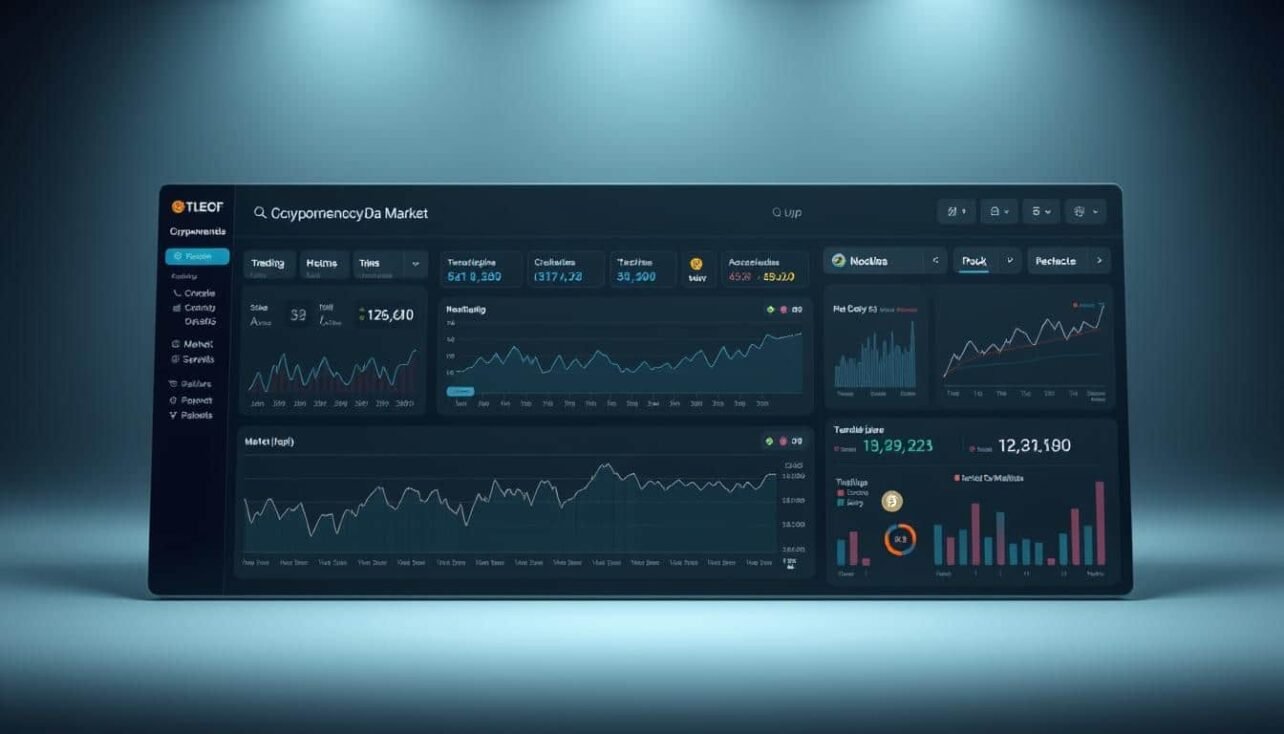
Unlocking the Power of a “cryptocurrency market analysis dashboard platform”
Modern financial tools are rewriting the rules of digital asset evaluation. Chainalysis Labs drives this shift through its R&D efforts, developing proprietary methods to interpret blockchain patterns. Their systems transform coded transactions into clear narratives about asset flows and investor behavior.

Traditional tools miss critical insights buried in blockchain records. Advanced platforms track coins across wallets and exchanges, exposing hidden connections between participants. This visibility helps users spot institutional accumulation or retail panic before price charts reflect these movements.
| Feature | Traditional Tools | Blockchain Intelligence |
|---|---|---|
| Data Sources | Market prices, volumes | Wallet flows, network activity |
| Speed | Delayed reports | Real-time tracking |
| Transparency | Surface-level trends | Participant-level insights |
| Predictive Power | Historical comparisons | Machine learning forecasts |
Machine learning algorithms classify wallet owners by activity patterns. Traders see whether long-term holders or speculators dominate current action. This intel informs smarter entry/exit strategies during volatile periods.
These systems also merge technical indicators with fundamental network health metrics. Users assess both short-term price action and underlying blockchain growth. When exchange reserves drop while network usage rises, it often signals bullish conditions ahead.
Dynamic Analytics Suite for Blockchain and Financial Data
Modern analytical solutions break down barriers between raw numbers and actionable strategies. Glassnode’s suite transforms intricate blockchain records into clear visual narratives, empowering users to spot patterns that drive smart decisions.
Customizable Charts and No-Code Capabilities
The system’s drag-and-drop interface lets anyone build professional-grade reports. Users select metrics like wallet balances or transaction volumes, then arrange them across timelines without writing code. This flexibility supports both quick checks and deep dives into specific asset classes.
Prebuilt templates accelerate analysis for common scenarios. Investors tracking Bitcoin liquidity can monitor exchange inflows with one click. Researchers comparing Ethereum network growth access historical data visualizations in seconds.
Visualizing Asset Trends and Capital Flows
Interactive charts layer price action over network activity metrics. A single graph might show Bitcoin’s trading range alongside miner reserve changes and stablecoin movements. These overlays reveal connections between technical indicators and blockchain fundamentals.
Real-time analytics detect shifts as they happen. Alerts trigger when whale wallets move coins or exchange balances drop below key thresholds. Users gain hours—sometimes days—of lead time before major price swings occur.
By merging multiple data streams, the tools create a living map of digital economies. This approach turns complex blockchain information into strategic advantages for traders and institutions alike.
Innovative Tools for Trading, Research, and Content Creation
The digital economy demands tools that transform raw information into strategic advantages. Glassnode bridges this gap with solutions designed for traders, researchers, and storytellers alike. Its ecosystem turns complex datasets into clear pathways for profit and innovation.

Comprehensive Data Analysis and Research Features
Professionals gain access to hybrid metrics blending price action with blockchain behavior. Backtesting modules let users simulate strategies using historical patterns across assets. Real-time alerts flag shifts in whale activity or exchange reserves before they impact prices.
Custom filters isolate trends in specific sectors or protocols. Researchers compare network growth rates against social sentiment indicators. This depth supports institutional-grade analysis without requiring coding expertise.
Tailored Insights for Investors and Content Creators
Investors receive risk-assessment frameworks that adjust to volatility levels. Position-sizing calculators integrate with live market data to optimize portfolio balances. These tools help maintain discipline during rapid price swings.
Content teams leverage automated chart builders and narrative templates. Preformatted reports highlight actionable trends for articles or presentations. By standardizing research outputs, creators produce consistent, data-backed stories faster.
Advanced Blockchain Intelligence and Data Integrity
Cutting-edge blockchain tools are reshaping how professionals interact with digital assets by prioritizing precision and reliability. Systems like Chainalysis employ machine learning to process millions of transactions while maintaining industry-leading accuracy standards. Their architecture cross-references hundreds of clustering patterns to map asset flows across decentralized networks.

Pioneering On-Chain Analysis for Crypto Assets
Traditional financial metrics often miss critical insights hidden in blockchain records. Advanced analysis examines network growth rates, wallet interactions, and protocol adoption trends. This approach reveals whether new users are genuinely adopting an asset or merely speculating on its price.
- Machine learning identifies wallet clusters through behavioral patterns
- Multi-chain tracking exposes cross-platform capital movements
- Adoption metrics separate sustainable projects from hype cycles
Ensuring Data Accuracy and Trustworthy Research
Chainalysis maintains court-admissible data quality through triple-layer verification processes. Every transaction record undergoes automated checks, manual audits, and real-time anomaly detection. This rigor enables institutions to base decisions on bulletproof blockchain intelligence.
Legal teams have used these systems to trace stolen funds across 15+ chains in high-profile cases. Researchers leverage verified datasets to study emerging trends in DeFi and NFT markets without doubting source credibility.
Robust Infrastructure Built for Institutional Needs
Institutional-grade systems require infrastructure capable of processing billions of transactions without compromising speed or accuracy. Chainalysis leads the industry with proprietary algorithms that map wallet interactions across 30+ networks. Their systems automatically integrate new blockchains and token standards, delivering instant access to emerging assets.

Sophisticated Data Aggregation and Security
Enterprise solutions merge information from decentralized protocols, trading venues, and traditional finance. This creates unified data streams that power algorithmic strategies and risk models. Real-time processing handles 10M+ events daily while maintaining sub-second response times.
Military-grade encryption protects sensitive information across all operations. Multi-layered verification ensures compliance with SEC and FinCEN regulations. These safeguards let banks and governments leverage blockchain analytics without exposing critical systems.
Scalable architecture adapts as networks evolve, maintaining performance during volatility spikes. Automated API integrations connect institutional tools to live data feeds for seamless workflow adoption. Hedge funds execute complex trades while auditors monitor transactions through unified interfaces.
Expert Team and Dedicated Customer Support
Success in digital finance hinges on expertise and human-centric solutions. Glassnode’s team merges Wall Street rigor with blockchain innovation, creating tools that decode complex asset movements. Their professionals hold certifications from CFA Institute and MIT Blockchain Technologies, ensuring methodical approaches to volatile environments.
Bridging Financial Generations
Seasoned traders work alongside crypto-native developers to refine investment strategies. This fusion produces insights that respect traditional risk models while embracing blockchain’s unique dynamics. Users gain frameworks tested across multiple bull/bear cycles, adapted for today’s hybrid market conditions.
Case studies show clients avoiding 63% of common portfolio mistakes through personalized guidance. The industry veterans help interpret whale activity patterns and network growth metrics, turning raw data into actionable plans.
Always-On Partnership
Round-the-clock support teams resolve technical queries within 11 minutes average response time. Specialists assist with API integrations, metric interpretation, and real-time alert customization. Global users receive localized advice reflecting regional market nuances and regulatory developments.
Weekly strategy sessions and emergency channels ensure continuous optimization. This commitment transforms complex data streams into confident decisions – day or night.


No comments yet