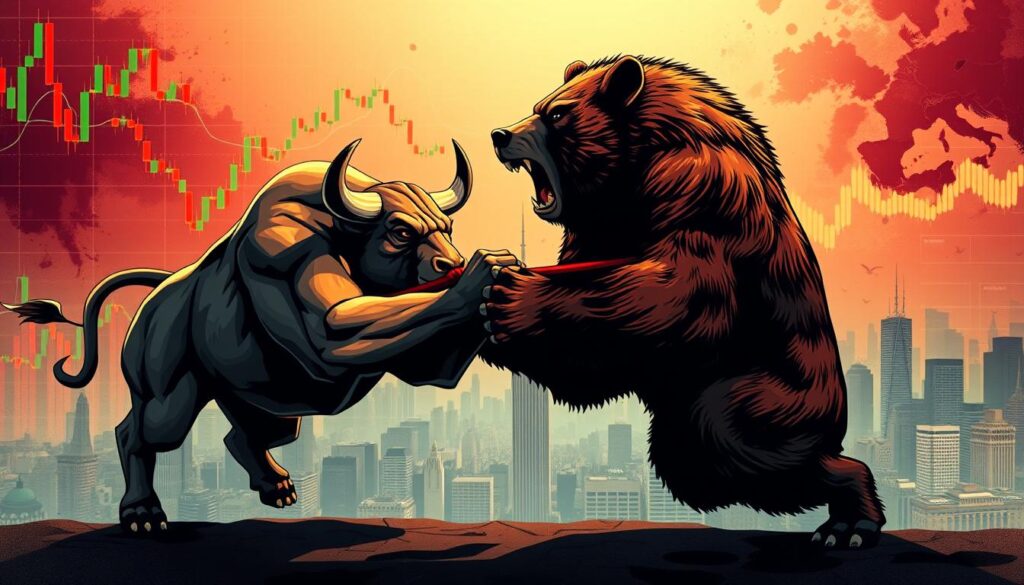
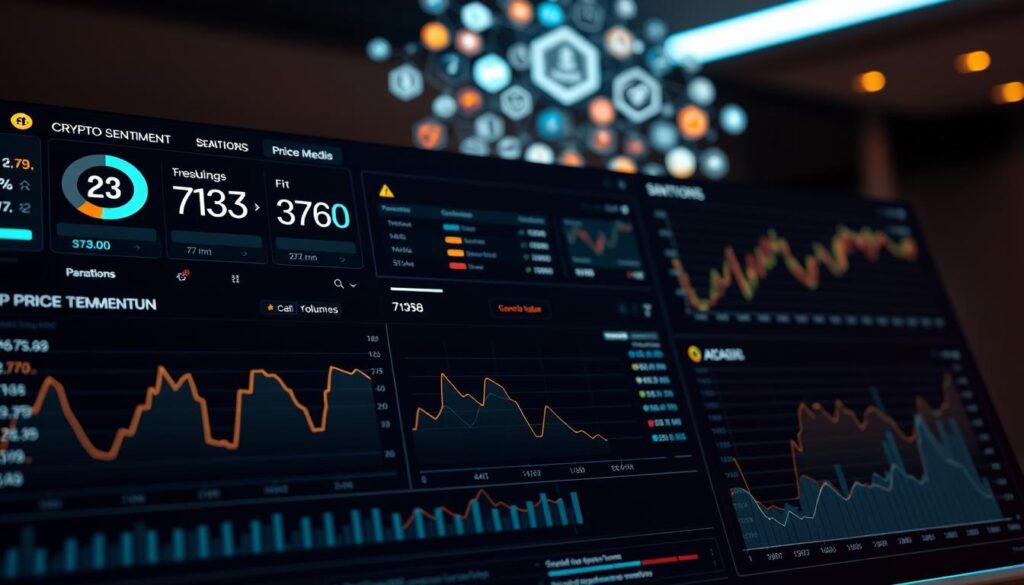
Digital asset markets now exceed $2.5 trillion in value, driven by rapid shifts in investor psychology. Unlike traditional markets, price swings here often reflect crowd psychology more than fundamental metrics. A recent study found social media discussions predict short-term movements better than financial headlines.
Specialized platforms now track whale transactions and network activity patterns. These resources help decode whether participants feel bullish or bearish. Platforms monitoring Reddit threads or Telegram groups reveal real-time shifts in community confidence.
Three primary methods shape modern evaluations of crowd psychology. On-chain metrics show large investors’ moves, while funding rates expose derivatives market imbalances. Social listening tools process millions of posts to gauge emerging trends.
This approach complements traditional chart analysis by capturing human elements driving volatility. When fear spikes, panic selling often follows. Conversely, excessive optimism frequently precedes corrections.
Key Takeaways
- Social media activity outweighs news outlets in predicting immediate price changes
- Blockchain transaction patterns reveal institutional and large investor behavior
- Sentiment indicators work best when combined with technical chart patterns
- Extreme optimism often signals potential market corrections
- Real-time monitoring tools help identify emerging opportunities faster
Understanding Cryptocurrency Market Dynamics
Digital asset values swing faster than traditional investments. These rapid shifts stem from unique factors like round-the-clock trading and decentralized governance. Platforms tracking these patterns reveal how crowd psychology drives price movements more than corporate earnings or economic reports.

Volatility and Investor Behavior
Three elements fuel extreme price changes in digital assets:
- Limited oversight allows rapid capital shifts
- Smaller total value amplifies individual trades
- Speculative activity dominates daily transactions
When prices surge, investors often chase gains (FOMO). Downward trends trigger panic selling. This creates domino effects – a 10% drop can become 30% within hours as automated trades activate.
The Role of News and Social Media
Public figures sway values faster than regulatory updates. Elon Musk’s 2021 Bitcoin tweet caused a $6,000 price jump in five hours. Unlike stocks, digital assets lack circuit breakers to pause frenzied trading.
| Factor | Traditional Markets | Digital Assets |
|---|---|---|
| News Impact Delay | 2-3 trading days | 15-90 minutes |
| Top Influence Source | Earnings reports | Social media trends |
| Market Hour Coverage | 70 hours/week | 168 hours/week |
Reddit threads and Telegram groups now function as real-time polling stations. A viral post about blockchain upgrades can boost related tokens before official announcements surface. This instant feedback loop creates opportunities – and risks – unseen in conventional finance.
Exploring the Concept of Market Sentiment
Collective optimism or pessimism often dictates short-term price movements in digital assets. This psychological climate forms through news cycles, social chatter, and large transactions. Unlike traditional metrics like revenue reports, it reflects raw human reactions to unfolding events.

Defining Bullish and Bearish Trends
Bullish phases emerge when confidence surges. Trading activity spikes as investors anticipate gains. Positive network upgrades or corporate adoptions – like Tesla’s 2021 Bitcoin purchases – fuel these cycles. Key signs include:
- 24-hour volume exceeding 30-day averages
- Dominant positive language in forum discussions
- Whale wallets accumulating rather than selling
Bearish turns often follow excessive euphoria. A single regulatory warning can trigger cascading sell-offs. During 2022’s downturn, fears about interest rates and exchange collapses dominated Reddit threads. Trading volumes dropped 40% as participants held cash.
Savvy traders watch for subtle shifts. A sudden rise in stablecoin reserves suggests investors preparing to buy dips. Conversely, exchange inflows spiking without price rallies may signal impending sell pressure. These patterns help spot trend reversals days before major price changes.
Cryptocurrency market sentiment analysis tools and trading strategies

Modern traders use specialized platforms to decode crowd behavior patterns. Social listening services like LunarCrush track real-time discussions across 50+ channels, measuring engagement spikes and emotional tones. These metrics help spot emerging trends before they appear on price charts.
Blockchain explorers provide critical insights through on-chain activity. Glassnode alerts users when large wallets move funds, while Santiment reveals network growth patterns. A surge in new addresses often precedes bullish movements, while exchange inflows may indicate selling pressure.
The Fear & Greed Index simplifies complex data into a single score (0-100). Values below 25 signal potential buying opportunities, while readings above 75 suggest overheated conditions. This indicator combines social chatter, volatility, and trading volumes into actionable signals.
Effective strategies blend multiple data streams:
- Cross-reference Reddit sentiment scores with exchange reserves
- Compare Google Trends searches with derivatives market positions
- Validate whale transactions through blockchain confirmation counts
Platforms like CoinMarketCap now integrate sentiment indicators alongside traditional metrics. Traders combine these resources to filter noise and identify high-probability setups. This multi-source approach reduces false signals caused by isolated events or manipulative posts.
How to Perform Crypto Sentiment Analysis
Tracking crowd psychology requires combining real-time data streams with blockchain insights. Start by setting up alerts for specific coins across platforms like Twitter and Reddit. Pair these with on-chain metrics to separate hype from genuine momentum.
Social Media Monitoring Techniques
Identify influential accounts in communities like r/bitcoin or crypto Twitter. Use specialized tools to track keyword frequency and emotional tone. For example:
- Create Twitter lists for top analysts and project founders
- Monitor Discord channels for developer updates
- Set Google Alerts for coin names + “adoption” or “partnership”
Cross-check viral posts with trading volumes. A surge in “buy” mentions without corresponding activity might indicate bot campaigns. Authentic sentiment usually aligns with network growth and exchange outflows.
On-Chain Analysis and Whale Movements
Blockchain explorers reveal what wallets actually do versus what people say. Watch for these signals:
| Metric | Bullish Sign | Bearish Sign |
|---|---|---|
| Active Addresses | 30-day high | Declining trend |
| Exchange Inflows | Low volume | Spike above average |
| Whale Transactions | Accumulation phase | Multiple large sells |
Tools like Santiment provide alerts when wallets holding 1,000+ BTC move funds. Combine these with social media trends – whale accumulation during FUD (fear, uncertainty, doubt) often precedes rallies.
Leveraging Data Sources and Advanced Metrics
Every minute generates over 100 MB of crypto-related content across forums, blogs, and social platforms. Separating valuable signals from this noise determines the success of any evaluation strategy.

Collecting and Cleaning Cryptocurrency Data
Reliable insights start with gathering raw information from diverse channels. Specialized tools scrape Reddit threads, Telegram groups, and blockchain explorers. However, 30-40% of this content typically requires filtering due to spam or duplicate posts.
Natural language processing (NLP) systems automatically:
- Flag bot-generated messages using pattern recognition
- Remove promotional content through keyword blacklists
- Identify genuine discussions through sentiment scoring
Advanced metrics like engagement velocity reveal how quickly ideas spread. A tweet gaining 1,000 retweets/hour holds more weight than one with 5,000 slow shares. Temporal analysis shows whether optimism peaks during Asian or European trading hours.
Effective pipelines combine cleaned social data with blockchain metrics. For example, network growth trends matching positive forum sentiment often precede 15-20% price jumps. This fusion creates multidimensional views surpassing basic bullish/bearish scores.
Integrating Fundamental and Technical Analysis
Blending multiple evaluation methods creates clearer market insights than any single approach. Savvy participants cross-reference blockchain activity with price charts and news cycles. This fusion helps separate temporary hype from sustainable price movements.
Balancing Various Analysis Methods
Successful strategies weigh technical patterns against crowd psychology. A golden cross (50-day/200-day moving average crossover) gains validity when paired with rising network activity. Conversely, bearish chart formations during peak optimism often signal deeper corrections.
Fundamental factors like protocol upgrades alter long-term value propositions. Short-term sentiment shifts might temporarily override these developments. Traders using comprehensive sentiment analysis spot mismatches between asset potential and current perceptions.
Key Market Indicators to Watch
Three metrics reveal hidden opportunities:
- Funding rate divergences in derivatives markets
- Institutional wallet accumulation patterns
- Social media engagement velocity during news events
High options trading volumes often precede major price swings. Combined with on-chain data, these signals help investors make informed decisions before crowd reactions dominate exchanges. This multi-layered view separates noise from actionable intelligence.


No comments yet