
The cryptocurrency market’s notorious volatility makes long-term forecasting challenging for investors and traders alike. While many technical analysis methods exist, Elliott Wave theory stands out as a powerful framework for understanding market psychology and predicting potential price movements. This comprehensive guide will show you how to apply Elliott Wave theory to cryptocurrency forecasting, helping you identify potential entry and exit points for your long-term investment strategy.
Understanding Elliott Wave Theory Fundamentals
Basic Elliott Wave pattern showing 5-wave impulse followed by 3-wave correction
Developed by Ralph Nelson Elliott in the 1930s, Elliott Wave Theory suggests that market prices move in repetitive patterns driven by investor psychology. The theory identifies two types of waves: motive waves that move with the primary trend and corrective waves that move against it.
The Five-Wave Impulse Pattern
In the direction of the primary trend, price movements unfold in a five-wave structure known as an impulse wave. These waves are labeled as 1, 2, 3, 4, and 5, with waves 1, 3, and 5 moving in the trend direction while waves 2 and 4 are smaller retracements against the trend.
The Three-Wave Corrective Pattern
After the five-wave impulse completes, a three-wave corrective pattern labeled A-B-C moves against the primary trend:
Fractal Nature of Elliott Waves
One of the most powerful aspects of Elliott Wave theory is its fractal nature. Each wave can be subdivided into smaller waves of the same pattern, and is itself part of a larger wave pattern. This allows analysts to identify wave patterns across multiple timeframes, from hourly charts to multi-year cycles.
Fibonacci Relationships in Elliott Wave Analysis

Fibonacci retracement levels applied to Elliott Wave patterns in cryptocurrency markets
Fibonacci ratios play a crucial role in Elliott Wave analysis, helping traders identify potential reversal points and price targets. These mathematical relationships appear consistently in wave movements:
| Wave Relationship | Common Fibonacci Ratio | Application in Crypto Markets |
| Wave 2 retracement of Wave 1 | 50%, 61.8%, 76.4% | Often deeper in crypto due to higher volatility |
| Wave 3 extension of Wave 1 | 161.8%, 261.8% | Frequently extended in crypto bull markets |
| Wave 4 retracement of Wave 3 | 23.6%, 38.2% | Often shallow in strong crypto trends |
| Wave 5 compared to Waves 1-3 | 61.8% of Waves 1-3 | Can extend dramatically in crypto FOMO phases |
Understanding these Fibonacci relationships helps cryptocurrency analysts project potential price targets and identify when a wave may be nearing completion.
Master Elliott Wave Analysis Faster
Download our free Elliott Wave Cryptocurrency Cheat Sheet with pattern recognition guides, Fibonacci reference tables, and wave counting rules specifically optimized for crypto markets.
Applying Elliott Wave Theory to Cryptocurrency Markets

Bitcoin price chart with Elliott Wave analysis showing the 2020-2021 bull run and subsequent correction
Cryptocurrency markets present unique characteristics that both challenge and enhance Elliott Wave analysis. The 24/7 trading environment, retail investor dominance, and susceptibility to news events create distinct wave patterns that differ from traditional markets.
Unique Challenges in Crypto Wave Analysis
Advantages
- Clear psychological cycles of fear and greed
- Strong trending moves with clear wave structures
- Retail-dominated market aligns well with crowd psychology principles
- Distinct market cycles that follow wave patterns
Challenges
- Extreme volatility can distort wave patterns
- Low liquidity in altcoins creates irregular movements
- Regulatory news can cause pattern-breaking gaps
- Market manipulation in smaller coins disrupts natural wave formation
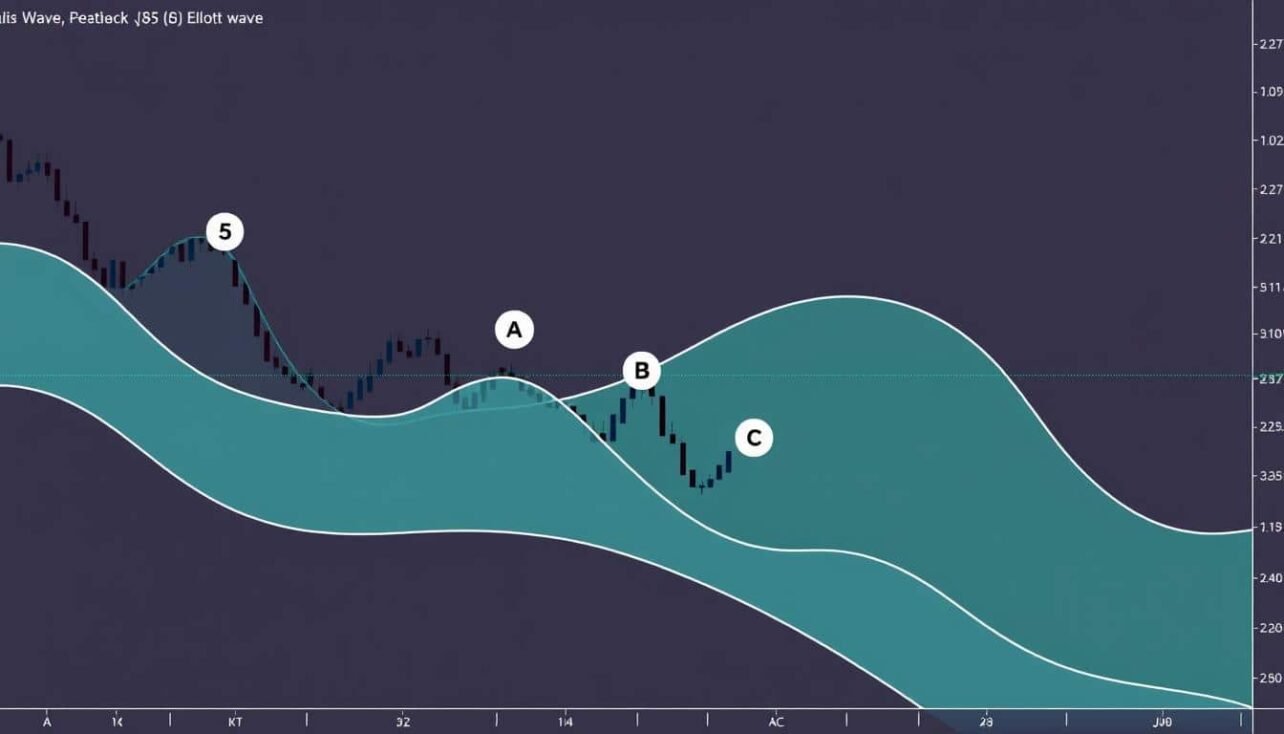
Historical Example: Bitcoin’s 2020-2021 Bull Run
Bitcoin’s 2020-2021 bull run provides an excellent case study for Elliott Wave theory cryptocurrency forecasting. The movement from $10,000 to $64,000 followed a textbook five-wave impulse pattern:
The subsequent correction followed an A-B-C pattern, with Wave A dropping to $30,000, Wave B recovering to $52,000, and Wave C completing the correction at around $29,000 in July 2021.
Step-by-Step Framework for Cryptocurrency Wave Counting

Step-by-step Elliott Wave counting process demonstrated on Ethereum chart
Accurate wave counting is the foundation of successful Elliott Wave analysis. Follow this systematic approach to identify wave patterns in cryptocurrency charts:
- Wave 2 never retraces more than 100% of Wave 1
- Wave 3 is never the shortest of Waves 1, 3, and 5
- Wave 4 never overlaps with the price territory of Wave 1 (except in diagonal patterns)
Common Wave Patterns in Cryptocurrency Markets
Certain Elliott Wave patterns appear frequently in cryptocurrency markets:
Extended Third Waves
Cryptocurrencies often exhibit extended third waves during bull markets, driven by FOMO (fear of missing out) and media attention. These extensions can reach 2.618 or even 4.236 times the length of Wave 1.
Diagonal Patterns
Leading and ending diagonals frequently appear in cryptocurrency markets, especially at the beginning of new trends or the end of exhausted ones. These wedge-shaped patterns signal transitions between major market phases.
Enhance Your Crypto Technical Analysis
Access professional-grade charting tools with built-in Elliott Wave indicators, Fibonacci calculators, and cryptocurrency-specific analysis features.
Integrating Elliott Wave with Other Cryptocurrency Metrics

Elliott Wave analysis enhanced with on-chain metrics for more accurate cryptocurrency forecasting
While Elliott Wave theory provides a powerful framework for cryptocurrency forecasting, combining it with other analysis methods significantly improves accuracy. Here’s how to integrate complementary approaches:
On-Chain Metrics
Blockchain data offers unique insights that can validate Elliott Wave counts:
Market Sentiment Analysis
Elliott Wave theory is fundamentally about market psychology, making sentiment indicators natural companions:
Creating a Long-Term Cryptocurrency Forecast

Hypothetical 5-year Elliott Wave forecast for Bitcoin with key price targets and support/resistance zones
Developing a long-term Elliott Wave forecast for cryptocurrencies requires identifying the current position within larger degree waves and projecting future movements. Here’s a hypothetical 5-year Bitcoin forecast based on Elliott Wave principles:
Current Position Assessment
As of 2023, Bitcoin appears to be in a larger degree corrective wave following the 2021 bull market peak. This correction likely represents Wave 2 of a Supercycle that began at the 2018 bear market low.
Projected Wave Sequence
| Wave | Projected Timeframe | Price Target Range | Key Characteristics |
| Wave 3 Impulse | 2024-2026 | $100,000-$250,000 | Strongest wave with institutional adoption and mainstream acceptance |
| Wave 4 Correction | 2026-2027 | $75,000-$120,000 | Complex correction with multiple ABC patterns |
| Wave 5 Impulse | 2027-2028 | $250,000-$500,000 | Final wave with potential diagonal structure and diminishing momentum |
Key Support and Resistance Zones
Based on Fibonacci relationships between projected waves, these price levels will likely serve as significant support and resistance zones:
Support Zones
- $28,000-$30,000 (Wave 1 high from previous cycle)
- $42,000-$45,000 (38.2% retracement of Wave 3)
- $69,000-$75,000 (23.6% retracement of Wave 3)
Resistance Zones
- $69,000-$70,000 (Previous all-time high)
- $100,000 (Psychological level)
- $161,800 (161.8% extension of Wave 1)
- $250,000-$275,000 (261.8% extension of Wave 1)
Essential Tools and Resources for Elliott Wave Cryptocurrency Analysis

Professional charting platform with Elliott Wave tools for cryptocurrency analysis
Effective Elliott Wave analysis requires the right tools and resources. Here are the essential platforms and communities for cryptocurrency wave analysts:
Recommended Charting Platforms
TradingView
The most popular platform with extensive Elliott Wave tools, custom indicators, and a large community of crypto analysts sharing ideas.
Key Features: Auto Fib Retracement tool, Elliott Wave oscillator, wave counting tools
Coinigy
Cryptocurrency-specific platform with advanced charting and access to multiple exchanges for comprehensive market analysis.
Key Features: Multi-exchange support, advanced drawing tools, portfolio tracking
MotiveWave
Professional-grade software with advanced Elliott Wave analysis tools designed specifically for wave counting and pattern recognition.
Key Features: Automated wave counting, Elliott Wave templates, Fibonacci clustering
Elliott Wave Communities and Resources

Educational resources for mastering Elliott Wave theory in cryptocurrency markets
Join Our Cryptocurrency Elliott Wave Community
Connect with fellow Elliott Wave analysts, share chart ideas, and get feedback on your wave counts in our dedicated cryptocurrency technical analysis forum.
Limitations and Best Practices

Common Elliott Wave counting mistakes in cryptocurrency analysis and how to avoid them
While Elliott Wave theory provides valuable insights for cryptocurrency forecasting, it’s important to understand its limitations and follow best practices:
Limitations of Elliott Wave Analysis
Best Practices for Reliable Forecasting
Pro Tip: When in doubt about a wave count, zoom out to larger timeframes and re-establish the context of the current market position. Often, what seems unclear on a daily chart becomes obvious on a weekly or monthly view.
Conclusion: Mastering Elliott Wave Theory for Cryptocurrency Forecasting

Elliott Wave analysis can provide a significant edge in cryptocurrency investment decisions
Elliott Wave theory offers a powerful framework for understanding and forecasting cryptocurrency price movements. By identifying wave patterns, applying Fibonacci relationships, and integrating complementary analysis methods, traders and investors can gain valuable insights into potential market directions.
While no forecasting method is perfect, especially in the volatile cryptocurrency markets, Elliott Wave theory provides a structured approach to analyzing market psychology and price patterns. With practice, patience, and proper risk management, it can become an invaluable tool in your cryptocurrency analysis toolkit.
Remember that successful Elliott Wave analysis is both an art and a science. Continuous learning, regular practice, and maintaining an open mind to alternate scenarios will help you develop the skills needed for effective long-term cryptocurrency forecasting.
Take Your Elliott Wave Skills to the Next Level
Access our comprehensive Elliott Wave Cryptocurrency Course with 20+ video lessons, practice exercises, and real-time market analysis sessions.
No comments yet