Fibonacci Retracement Levels for Cryptocurrency Price Prediction

CMCryptocurrencies2 hours ago4 Views

Fibonacci spiral pattern found in nature showing the golden ratio that forms the basis of Fibonacci retracement levels for cryptocurrency price prediction

Fibonacci retracement levels have become an essential tool for cryptocurrency traders seeking to predict potential price reversals and support/resistance zones. This mathematical sequence, discovered centuries ago, has proven remarkably effective in modern financial markets, including the volatile world of cryptocurrency trading. In this comprehensive guide, we’ll explore how to leverage Fibonacci retracement levels to enhance your cryptocurrency price predictions and improve your trading decisions.

Understanding Fibonacci Retracement: Origins and Mathematical Basis

The Fibonacci sequence appears throughout nature and forms the basis of retracement levels

The Fibonacci sequence is a series of numbers where each number is the sum of the two preceding ones: 0, 1, 1, 2, 3, 5, 8, 13, 21, 34, 55, 89, 144, and so on. This sequence was introduced to Western Europe by Leonardo Pisano (known as Fibonacci) in the 13th century, though its origins trace back to ancient Indian mathematics between 450-200 BCE.

What makes this sequence remarkable is the ratio between consecutive numbers. As the sequence progresses, the ratio between adjacent numbers approaches approximately 0.618 (or its inverse, 1.618), known as the “Golden Ratio.” This ratio appears repeatedly in nature, art, architecture, and—importantly for traders—financial markets.

Why Fibonacci Works in Cryptocurrency Markets

Fibonacci retracement levels work in cryptocurrency markets for two primary reasons:
  • Market Psychology: Human behavior in markets often follows predictable patterns. The collective actions of traders create support and resistance levels that frequently align with Fibonacci ratios.
  • Self-Fulfilling Prophecy: As more traders use these levels to make decisions, the levels themselves become significant. When many traders place orders at Fibonacci levels, these levels naturally become important price points.
  • Natural Market Rhythms: Markets tend to move in waves with natural pullbacks. These retracements often correspond to Fibonacci ratios, making them valuable for predicting potential reversal points.
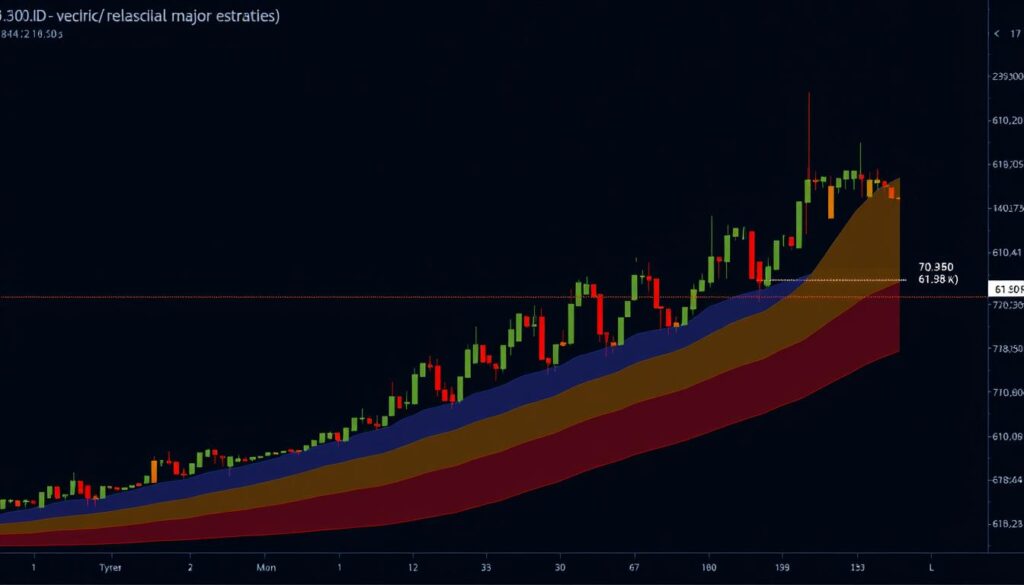
  • Bitcoin price chart showing Fibonacci retracement levels applied to a major price movement for cryptocurrency price prediction

    Bitcoin price chart with Fibonacci retracement levels showing key support and resistance zones

    Key Fibonacci Retracement Levels for Cryptocurrency Trading

    The most commonly used Fibonacci retracement levels in cryptocurrency trading are 23.6%, 38.2%, 50%, 61.8%, and 78.6%. While 50% is not derived from the Fibonacci sequence itself, it’s included because it’s a significant psychological level where traders often expect reversals.

    Fibonacci LevelCalculationSignificance in Crypto Trading
    23.6%Derived from dividing a number by the number three places to its rightShallow retracement, often seen in strong trends
    38.2%Derived from dividing a number by the number two places to its rightModerate retracement, common in bull markets
    50%Not a Fibonacci ratio but included for its psychological importanceMajor psychological level, significant support/resistance
    61.8%The Golden Ratio, derived from dividing a number by the next numberThe most powerful retracement level, often the “last line of defense”
    78.6%Square root of 0.618Deep retracement, often indicates potential trend reversal
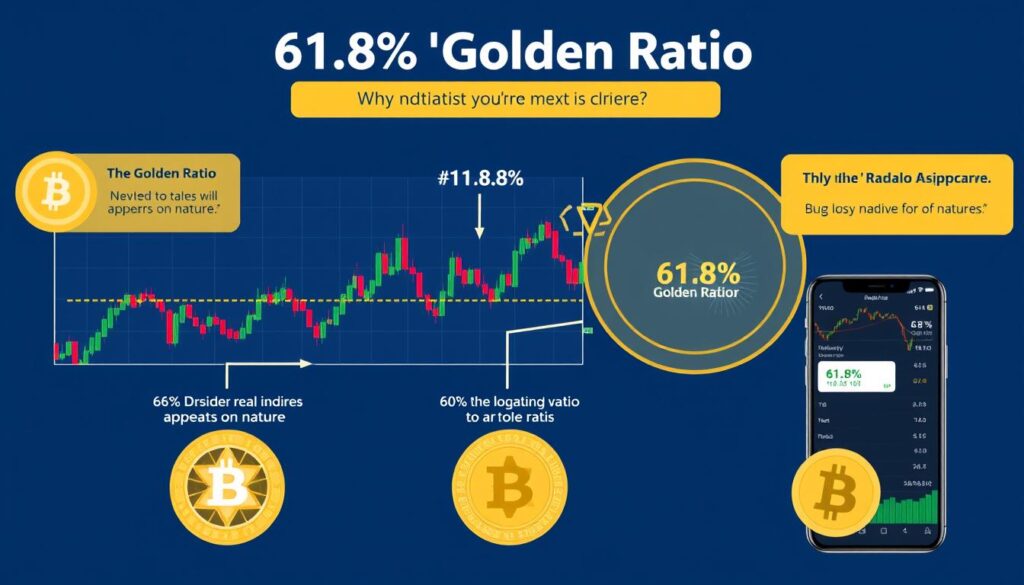
    Detailed explanation of the Golden Ratio (61.8%) Fibonacci level for cryptocurrency price prediction

    The 61.8% Golden Ratio is particularly significant in cryptocurrency price prediction

    How to Draw Fibonacci Retracement Levels on Cryptocurrency Charts

    Drawing Fibonacci retracement levels on cryptocurrency charts is straightforward once you understand the process. Here’s a step-by-step guide:
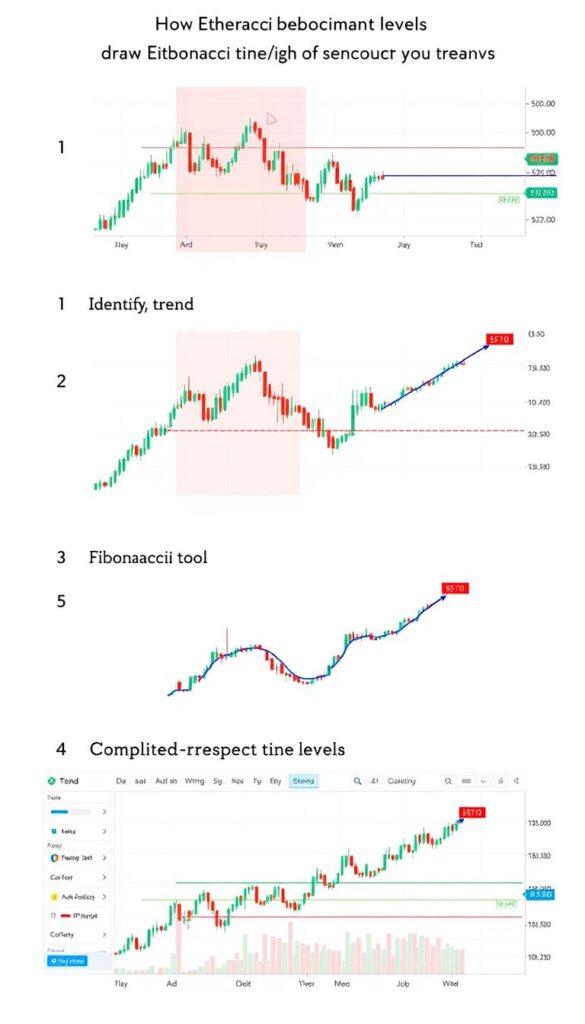
  • Identify the trend direction: Determine whether you’re analyzing an uptrend or downtrend.
  • Select significant price points: For an uptrend, select the low point (swing low) and drag to the high point (swing high). For a downtrend, do the opposite.
  • Apply the Fibonacci retracement tool: Most trading platforms have this tool built-in. Select it and connect your chosen points.
  • Observe the horizontal lines: The tool automatically draws horizontal lines at the key Fibonacci levels (23.6%, 38.2%, 50%, 61.8%, and 78.6%).
  • Monitor price action: Watch how the price reacts when it approaches these levels to identify potential support or resistance.
  • Step-by-step process of drawing Fibonacci retracement levels on an Ethereum chart for cryptocurrency price prediction

    Step-by-step process for drawing Fibonacci retracement on an Ethereum chart
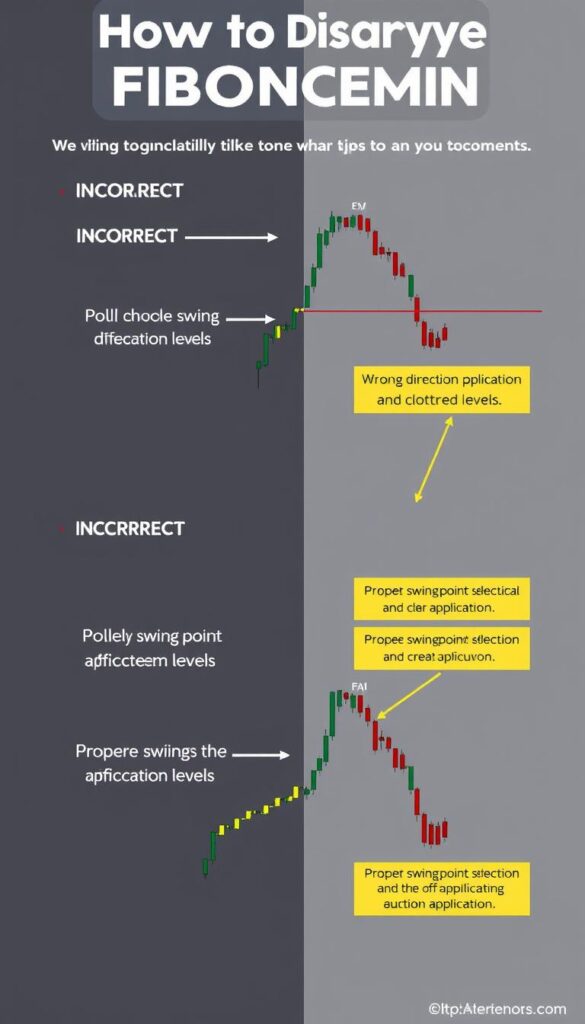
    Common mistakes to avoid when drawing Fibonacci retracement levels for cryptocurrency price prediction

    Common mistakes to avoid when drawing Fibonacci retracement levels

    Tips for Selecting the Right Swing Points

    The effectiveness of Fibonacci retracement levels depends heavily on selecting the appropriate swing points. Here are some tips:

  • Use significant highs and lows: Choose points that represent major price movements, not minor fluctuations.
  • Consider the timeframe: Longer timeframes (daily, weekly) produce more reliable Fibonacci levels than shorter ones.
  • Look for clear trends: Fibonacci works best in clear trending markets, not in choppy, sideways conditions.
  • Be consistent: Use the same methodology for selecting swing points across different analyses.
  • Practical Examples: Fibonacci Retracement in Bitcoin and Ethereum

    Bitcoin (BTC) Example
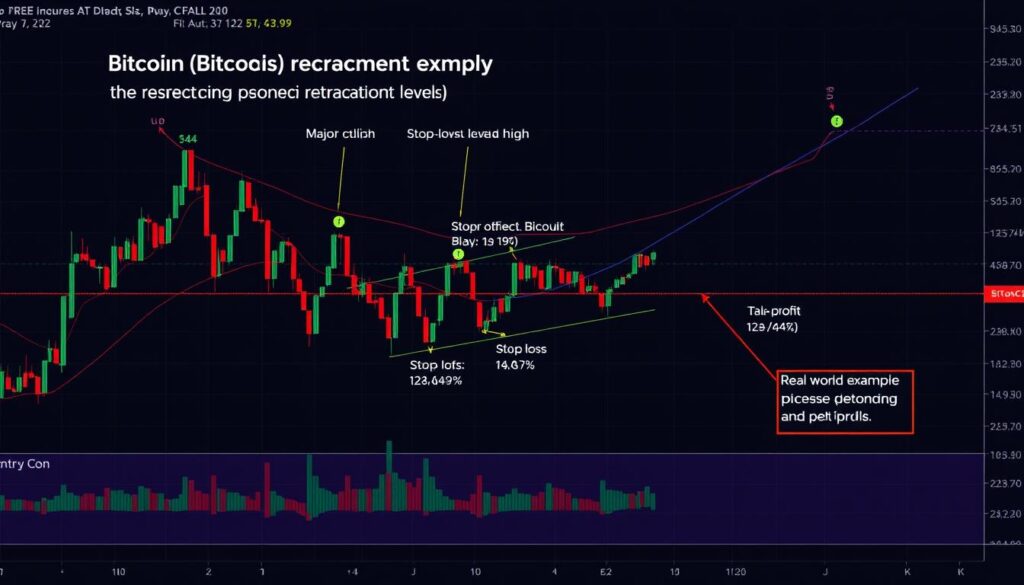
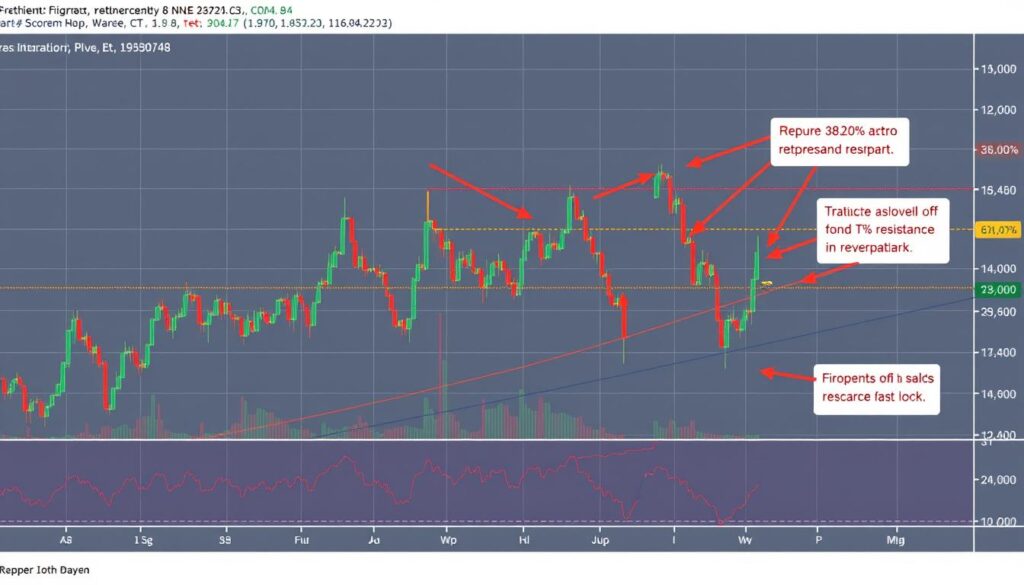
    Real-world example of Bitcoin price respecting Fibonacci retracement levels for cryptocurrency price prediction

    Bitcoin price action respecting the 61.8% Fibonacci retracement level during a bull market

    In this Bitcoin example, we can observe how price respected the key Fibonacci retracement levels during a significant uptrend:

  • Initial Uptrend: Bitcoin rose from $29,000 to $69,000 between July and November 2021.
  • Retracement: The price then retraced, finding strong support at the 38.2% level ($53,700).
  • Bounce and Continuation: After bouncing off this level, Bitcoin resumed its upward movement.
  • Trading Opportunity: Traders who identified this Fibonacci support level could have entered long positions with a favorable risk-reward ratio.
  • Ethereum (ETH) Example

    Ethereum price chart showing multiple Fibonacci retracement levels acting as support and resistance for cryptocurrency price prediction

    Ethereum price repeatedly finding support and resistance at Fibonacci retracement levels

    Ethereum provides another excellent example of Fibonacci retracement levels in action:

  • Downtrend Analysis: During a correction from $4,800 to $2,200, Ethereum made several attempts to recover.
  • 50% Retracement: The price consistently found resistance at the 50% retracement level ($3,500).
  • 61.8% Golden Ratio: When Ethereum finally broke above the 50% level, it found resistance exactly at the 61.8% level ($3,800).
  • Trading Strategy: Traders could have used these levels to set take-profit targets for short positions or to enter new shorts at resistance.
  • Master Fibonacci Retracement Trading

    Download our free Fibonacci retracement template for cryptocurrency trading. Includes pre-configured levels, entry/exit strategies, and risk management guidelines.

    Download Free Template

    Combining Fibonacci with Other Technical Indicators

    While Fibonacci retracement levels are powerful on their own, their effectiveness increases dramatically when combined with other technical indicators. This approach, known as confluence, provides stronger signals and reduces false positives.
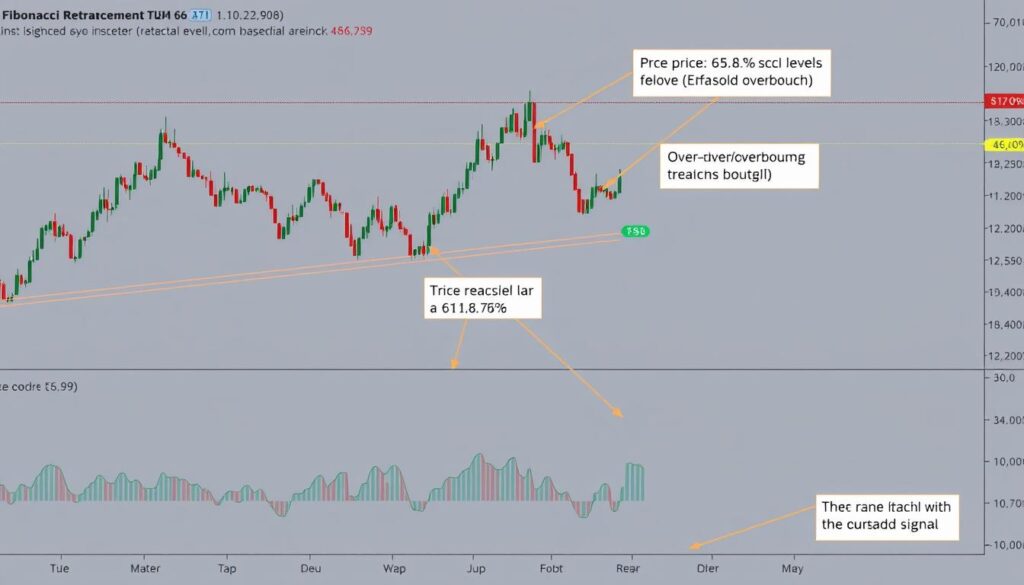
    Chart showing Fibonacci retracement levels combined with RSI indicator for stronger cryptocurrency price prediction signals

    Combining Fibonacci retracement with RSI for stronger trading signals

    Fibonacci + RSI (Relative Strength Index)

    The RSI is a momentum oscillator that measures the speed and change of price movements. When combined with Fibonacci retracement levels:

  • Oversold RSI at Fibonacci Support: When price reaches a Fibonacci support level (e.g., 61.8%) and RSI is oversold (below 30), it creates a strong buy signal.
  • Overbought RSI at Fibonacci Resistance: When price reaches a Fibonacci resistance level and RSI is overbought (above 70), it creates a strong sell signal.
  • Divergence at Fibonacci Levels: RSI divergence occurring at a Fibonacci level provides an even stronger reversal signal.
  • Fibonacci + Moving Averages

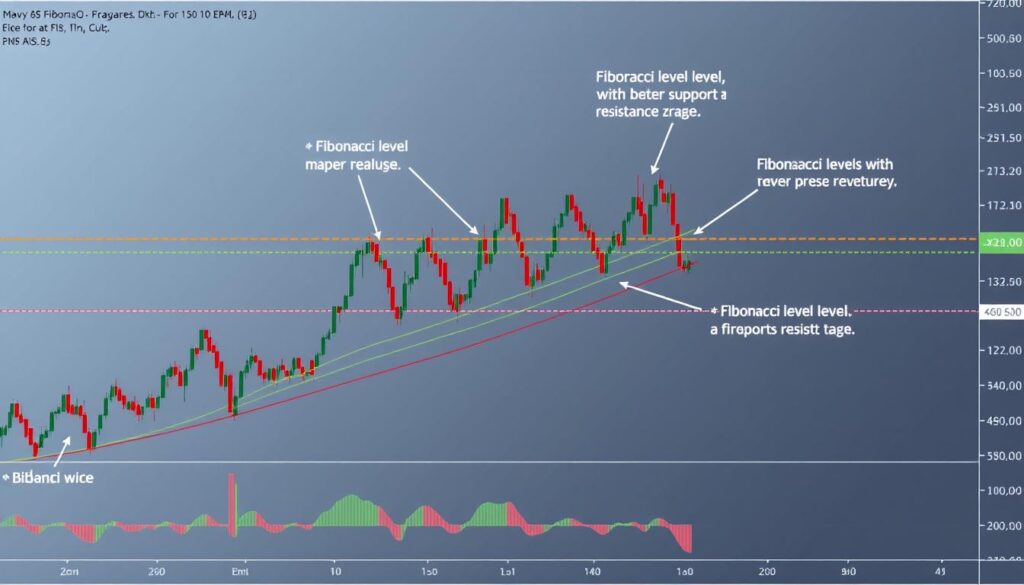
    Cryptocurrency chart showing Fibonacci retracement levels aligned with key moving averages for price prediction

    Fibonacci levels gaining strength when aligned with key moving averages

    Moving averages identify the average price over a specific period, smoothing out price action. When they align with Fibonacci levels:

  • Moving Average Confluence: When a key moving average (50, 100, or 200-day) aligns with a Fibonacci level, that level becomes significantly stronger.
  • Golden Cross at Fibonacci Support: A golden cross (50 MA crossing above 200 MA) occurring near a Fibonacci support level provides a powerful bullish signal.
  • Death Cross at Fibonacci Resistance: A death cross (50 MA crossing below 200 MA) occurring near a Fibonacci resistance level provides a strong bearish signal.
  • Fibonacci + Volume Profile

    Volume profile shows the trading activity at specific price levels. When combined with Fibonacci:
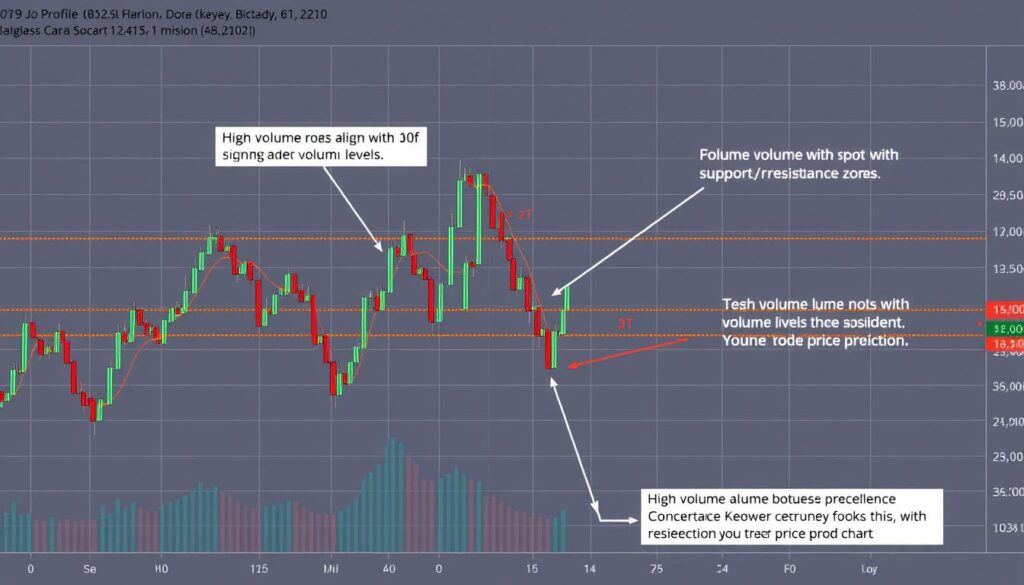
  • High Volume Nodes at Fibonacci Levels: When high trading volume aligns with a Fibonacci level, it confirms the significance of that level.
  • Volume Confirmation of Breakouts: Increased volume when breaking through a Fibonacci level confirms the validity of the breakout.
  • Low Volume at Fibonacci Levels: Low volume when approaching a Fibonacci level may indicate a weak reaction and potential breakthrough.
  • Volume profile analysis combined with Fibonacci retracement levels for cryptocurrency price prediction

    Volume profile confirming the significance of Fibonacci retracement levels

    Enhance Your Technical Analysis Skills

    Get our complete guide on combining Fibonacci retracement with other technical indicators for more accurate cryptocurrency price predictions.

    Download Complete Guide

    Real-World Case Studies: Successful and Unsuccessful Fibonacci Trades

    Successful Case Study: Bitcoin’s Golden Pocket Bounce
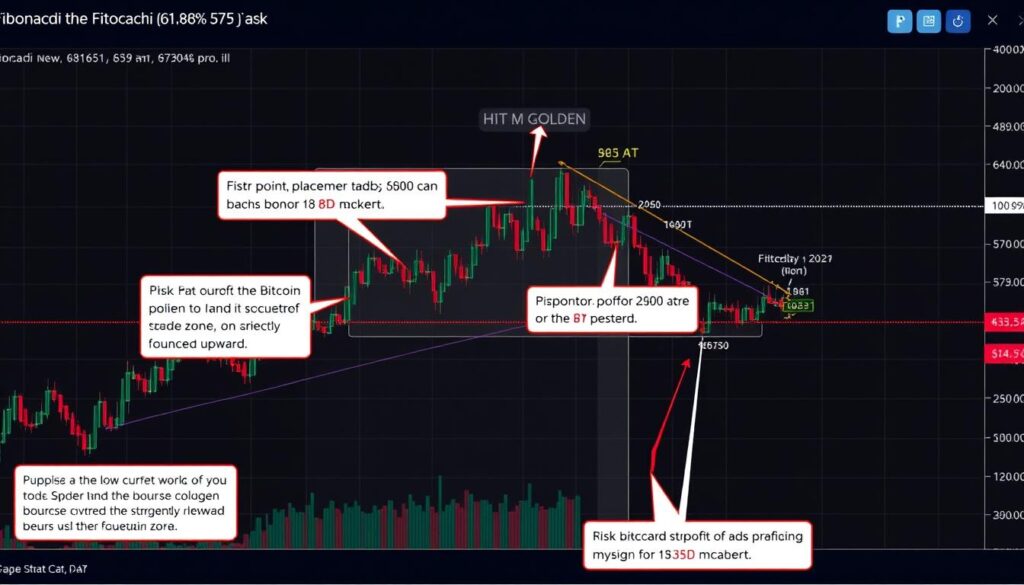
    Case study of a successful Bitcoin trade using the Fibonacci golden pocket for cryptocurrency price prediction

    Bitcoin’s strong bounce from the 61.8%-65% “Golden Pocket” Fibonacci zone

    In this case study from March 2023, a trader successfully used the Fibonacci “Golden Pocket” (the zone between 61.8% and 65%) to enter a profitable Bitcoin long position:

  • Market Context: Bitcoin had been in an uptrend, moving from $16,500 to $25,000.
  • Fibonacci Application: The trader drew Fibonacci retracement levels from the low to the high.
  • Entry Strategy: When Bitcoin retraced to the Golden Pocket zone around $19,800, the trader entered a long position.
  • Confirmation Signals: The entry was confirmed by bullish divergence on the RSI and increased buying volume.
  • Risk Management: A stop-loss was placed just below the 65% level at $19,400.
  • Result: Bitcoin bounced strongly from this level, reaching the 38.2% retracement level at $21,700, resulting in a 9.6% profit.
  • Unsuccessful Case Study: Ethereum’s Failed Support
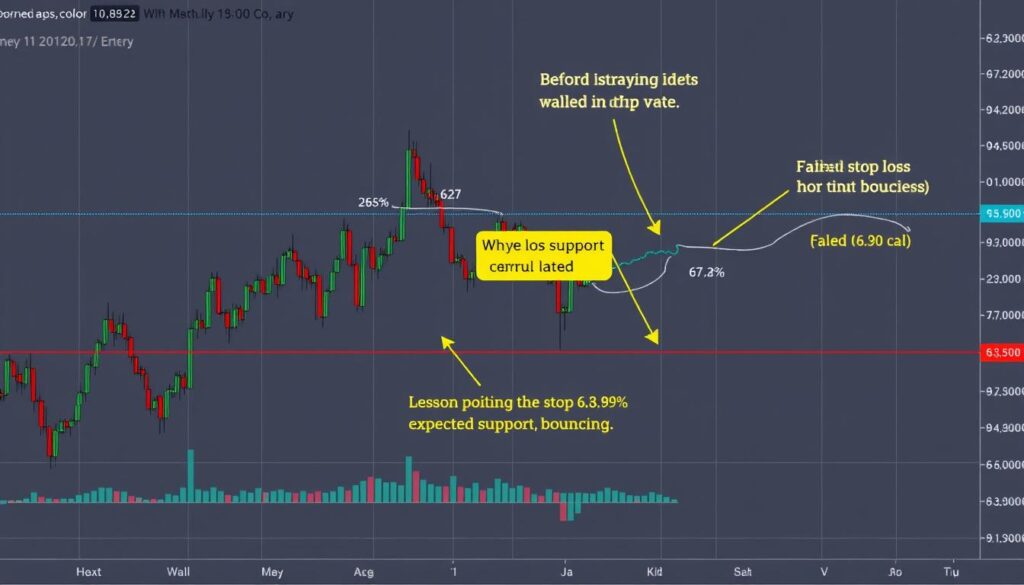
    Case study of an unsuccessful Ethereum trade where Fibonacci support levels failed for cryptocurrency price prediction

    Ethereum breaking through expected Fibonacci support levels, resulting in a failed trade

    Not all Fibonacci trades work out. This case study examines a failed trade where Ethereum broke through expected Fibonacci support:

  • Market Context: Ethereum had dropped from $2,000 to $1,400 and was attempting to recover.
  • Fibonacci Application: The trader drew Fibonacci retracement levels from the high to the low.
  • Entry Strategy: When Ethereum retraced to the 38.2% level at $1,630, the trader entered a long position, expecting support.
  • Warning Signs (Missed): Decreasing volume during the bounce and bearish divergence on multiple indicators.
  • Result: Ethereum broke through the 38.2% level and continued falling to the 23.6% level at $1,540, resulting in a 5.5% loss.
  • Lesson Learned: Fibonacci levels should not be used in isolation; confirming indicators and proper risk management are essential.
  • Common Mistakes to Avoid When Using Fibonacci Retracement

    Effective Fibonacci Usage

    • Using Fibonacci with trend confirmation
    • Combining with other technical indicators
    • Selecting significant swing points
    • Applying proper risk management
    • Using appropriate timeframes
    • Looking for confluence with other support/resistance

    Common Fibonacci Mistakes

    • Using Fibonacci in ranging/sideways markets
    • Relying solely on Fibonacci without confirmation
    • Selecting insignificant swing points
    • Ignoring market context and fundamentals
    • Using too many Fibonacci levels simultaneously
    • Forcing Fibonacci to fit your bias

    Mistake #1: Forcing Fibonacci on Unsuitable Charts
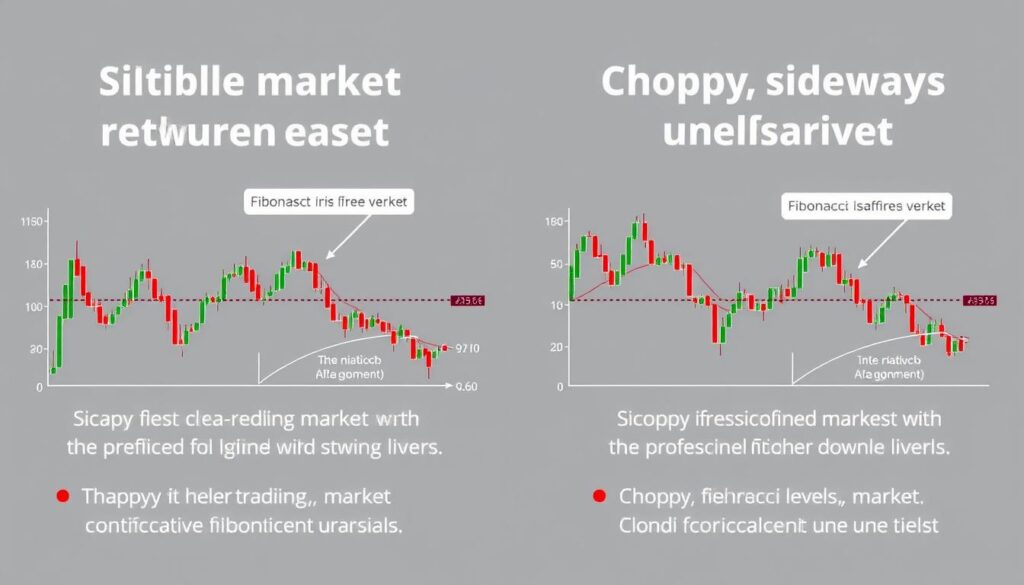
    Comparison of suitable vs unsuitable market conditions for Fibonacci retracement in cryptocurrency price prediction

    Suitable trending market (left) vs. unsuitable ranging market (right) for Fibonacci analysis

    Fibonacci retracement works best in trending markets with clear directional movement. Applying it to sideways, choppy markets often leads to false signals and losses. Before using Fibonacci, confirm that the market is in a clear trend.

    Mistake #2: Ignoring Market Context

    Fibonacci retracement is just one tool in technical analysis and should not be used in isolation. Always consider:

  • Market Sentiment: Is the broader market bullish or bearish?
  • Fundamental Factors: Are there upcoming events that could impact price (hard forks, regulatory news, etc.)?
  • Liquidity Conditions: Low liquidity periods can lead to false breakouts of Fibonacci levels.
  • Correlation with Bitcoin: For altcoins, Bitcoin’s movement often overrides technical patterns.
  • Mistake #3: Poor Risk Management

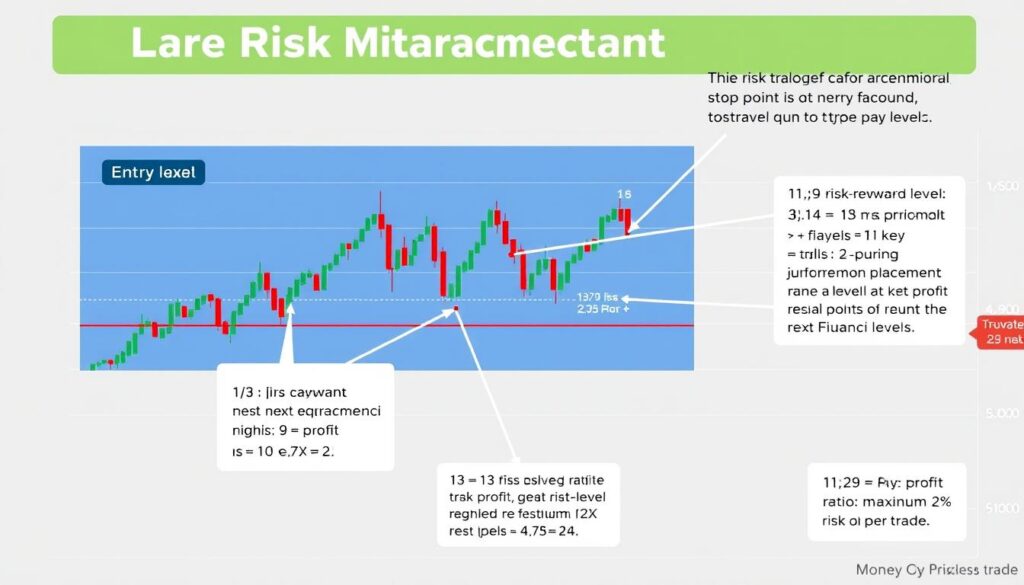
    Proper risk management techniques when trading with Fibonacci retracement levels for cryptocurrency price prediction

    Proper risk management when trading with Fibonacci retracement levels

    Even the best Fibonacci analysis can fail. Always implement proper risk management:

  • Set Stop-Losses: Place stop-losses just beyond the next Fibonacci level to limit potential losses.
  • Position Sizing: Never risk more than 1-2% of your trading capital on a single trade.
  • Risk-Reward Ratio: Aim for at least a 1:2 risk-reward ratio, preferably 1:3 or higher.
  • Take Partial Profits: Consider taking partial profits at each Fibonacci level rather than aiming for one large target.
  • Advanced Fibonacci Techniques for Cryptocurrency Trading

    Fibonacci Extensions for Price Targets
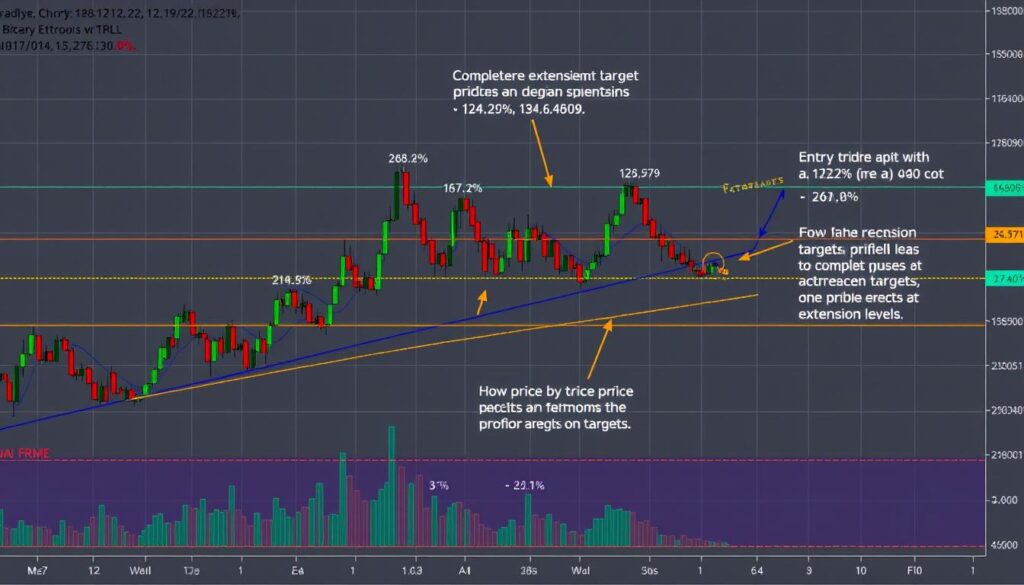
    Using Fibonacci extensions to set price targets in cryptocurrency trading for price prediction

    Using Fibonacci extensions to set precise price targets in cryptocurrency trading

    While retracement levels help identify potential reversal points, Fibonacci extensions help set price targets beyond the original trend. Common extension levels include 127.2%, 161.8%, and 261.8%.

    To use Fibonacci extensions:

  • Identify three points: the start of a move (A), the end of a move (B), and the retracement level (C).
  • Apply the Fibonacci extension tool to these points.
  • Use the extension levels (127.2%, 161.8%, etc.) as potential price targets.
  • Look for confluence with other resistance/support levels to confirm these targets.
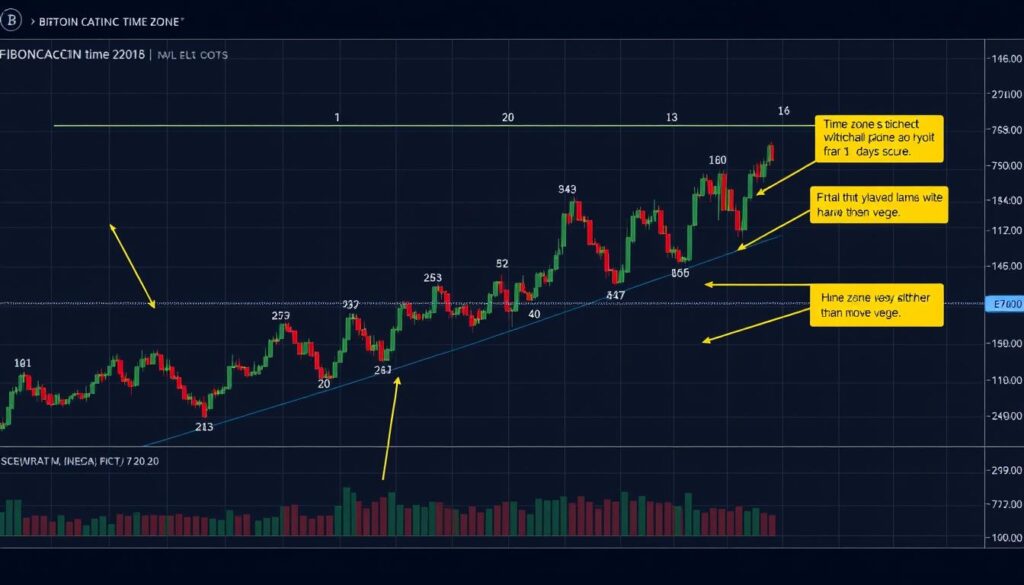
  • Fibonacci Time Zones

    Fibonacci time zones applied to cryptocurrency charts for timing price movements and predictions

    Fibonacci time zones helping predict when significant price movements might occur

    Fibonacci time zones help predict when significant price movements might occur, rather than at what price level. They apply the Fibonacci sequence to time rather than price.

    To use Fibonacci time zones:

  • Select a Significant Low or High: This becomes your starting point.
  • Apply the Fibonacci Time Zone Tool: This draws vertical lines at Fibonacci intervals (1, 2, 3, 5, 8, 13, 21, etc.) from your starting point.
  • Monitor Price Action: Watch for significant reversals or breakouts at these time intervals.
  • Combine with Price Levels: For maximum effectiveness, look for convergence between time zones and key price levels.
  • Multiple Timeframe Analysis

    Using Fibonacci retracement across multiple timeframes provides a more comprehensive view of potential support and resistance levels.
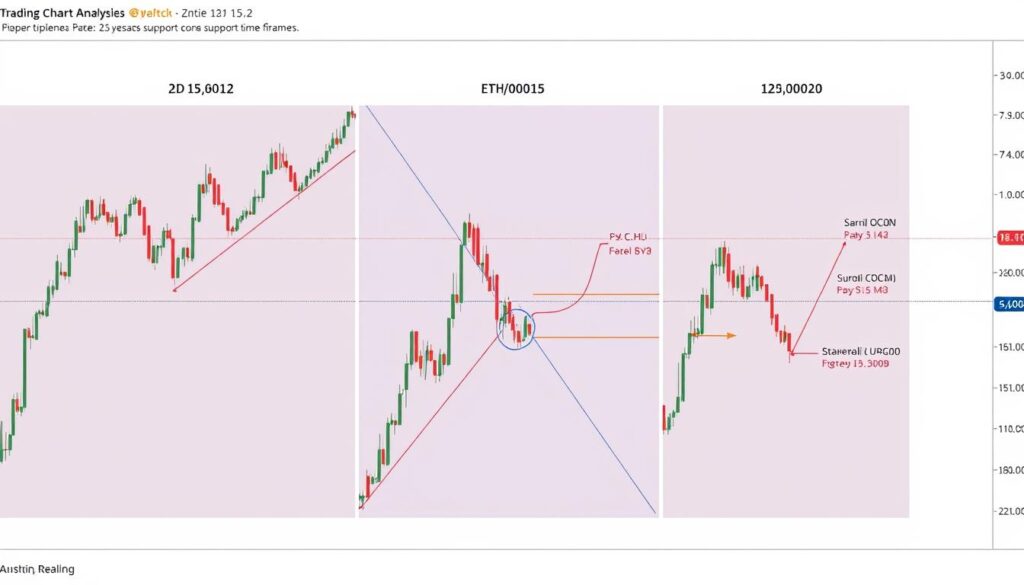
    Multiple timeframe analysis using Fibonacci retracement levels for cryptocurrency price prediction

    Fibonacci retracement analysis across daily, 4-hour, and 1-hour timeframes showing confluence

  • Higher Timeframe Dominance: Fibonacci levels on higher timeframes (weekly, daily) typically have stronger influence than those on lower timeframes.
  • Confluence Across Timeframes: When Fibonacci levels align across multiple timeframes, they create especially strong support/resistance zones.
  • Entry Refinement: Use higher timeframes to identify key levels, then switch to lower timeframes to fine-tune entries.
  • Conflicting Signals: When Fibonacci levels on different timeframes conflict, defer to the higher timeframe.
  • Conclusion: Responsible Use of Fibonacci Retracement in Cryptocurrency Trading

    Fibonacci retracement levels provide a powerful framework for predicting potential cryptocurrency price movements. When used correctly, they can help identify key support and resistance levels, offering valuable entry and exit points for trades. However, they are most effective when:

  • Combined with other indicators for confirmation rather than used in isolation
  • Applied to trending markets rather than ranging or sideways conditions
  • Used with proper risk management including appropriate stop-losses and position sizing
  • Considered within broader market context including fundamentals and sentiment
  • Remember that no technical analysis tool is infallible, especially in the volatile cryptocurrency markets. Fibonacci retracement levels should be one component of a comprehensive trading strategy, not the sole basis for trading decisions.

    By understanding both the power and limitations of Fibonacci retracement, you can use this ancient mathematical sequence to navigate the modern world of cryptocurrency trading more effectively, potentially improving your ability to predict price movements and make profitable trading decisions.

    Start Your Fibonacci Trading Journey Today

    Download our comprehensive Fibonacci Trading Bundle for cryptocurrency traders. Includes templates, guides, case studies, and expert strategies.

    Get Your Free Fibonacci Bundle

    Leave a reply

    Loading Next Post...
    Follow
    Sign In/Sign Up Sidebar Search Trending 0 Cart
    Popular Now
    Loading

    Signing-in 3 seconds...

    Signing-up 3 seconds...

    Cart
    Cart updating

    ShopYour cart is currently is empty. You could visit our shop and start shopping.