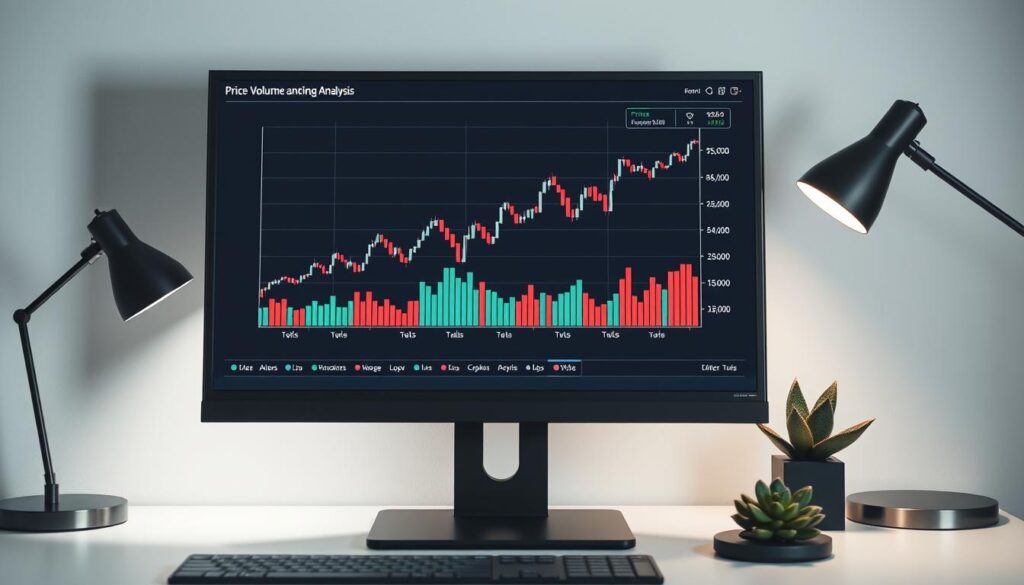
In the fast-paced world of digital assets, one metric stands out for its power and clarity. Trading volume acts as a heartbeat, showing the true strength behind every price move. It separates meaningful trends from simple noise.
Understanding this powerful information is not just for professionals. It is a core skill for anyone involved in the cryptocurrency market. This knowledge helps you make confident decisions and navigate volatility.
Our guide provides a complete path to mastery. We start with the basics and move to advanced strategies. You will learn to spot real opportunities and avoid common traps. This skill gives investors a clear edge.
We will explore key indicators and the vital link between price and activity. Real-world examples will show these concepts in action. You will gain a practical framework for trading success.
Key Takeaways
- Volume is a fundamental indicator of market strength and trend validity.
- Mastering volume analysis is essential for all levels of investors.
- This guide covers everything from basic concepts to advanced practical techniques.
- Proper analysis helps identify high-probability opportunities and confirms trend changes.
- Understanding the relationship between price action and volume is critical.
- The techniques apply across different timeframes and market conditions.
Understanding the Role of Trading Volume in Cryptocurrency
For those navigating cryptocurrency markets, understanding trading volume offers a window into genuine market participation. This metric reveals the actual level of activity behind price movements.
What is Trading Volume?
Trading volume represents the total amount of a specific digital asset exchanged during a set period. It’s typically measured in the cryptocurrency’s own units or equivalent fiat value.
For example, if 10,000 Bitcoins change hands in one day, the daily volume is 10,000 BTC. This simple measurement provides powerful insights into market behavior.
Why Volume is Vital for Market Analysis
Volume serves three critical functions in market evaluation. First, it indicates liquidity levels – high volume means easier entry and exit from positions.
Second, volume confirms price trends. Movements supported by substantial activity are more likely to sustain than those with low participation.
Finally, volume reflects market sentiment. Changing volume patterns over time reveal growing or declining interest in specific assets.
Effective analysis always combines volume examination with price action and other indicators. This comprehensive approach provides the clearest market picture.
How to Analyze Crypto Trading Volume
A powerful dynamic exists where significant price shifts are almost always accompanied by notable changes in trading activity. This relationship provides critical clues about the strength and sustainability of market movements.

High transaction levels during an upward price move signal strong buyer conviction. This suggests a trend may continue. Conversely, falling prices on high volume often indicate intense selling pressure.
Low activity during large price movements warns of weak participation. This lack of conviction can foreshadow a reversal. Understanding these patterns is a fundamental part of market analysis.
Understanding the Price-Volume Relationship
The table below summarizes key scenarios every investor should recognize.
| Price Action | Volume Level | Market Interpretation |
|---|---|---|
| Rising | High | Strong bullish confirmation; trend likely valid. |
| Rising | Low | Potential weakness; trend may be unsustainable. |
| Falling | High | Strong bearish confirmation; selling pressure is high. |
| Falling | Low | Possible exhaustion; sell-off may be ending. |
This relationship also creates volatility. High activity fuels larger price swings, which in turn attracts more participation. It is a self-reinforcing cycle.
Utilizing Volume-Based Indicators
Specialized tools simplify this analysis. These indicators process raw volume and price data into clear signals.
They help identify whether current activity is normal or a significant event. Examining these signals across different time frames provides a complete picture. This approach strengthens any trading strategy.
Key Volume Indicators and Their Applications
Specialized technical indicators transform raw market data into actionable insights. These tools measure the force behind price movements.
They help identify accumulation and distribution phases. This provides a deeper understanding of market momentum.
Money Flow Index (MFI)
The Money Flow Index (MFI) is a volume-weighted relative strength indicator. It oscillates between zero and one hundred.
This tool combines price and volume data. It identifies overbought and oversold conditions.
Readings above 80 suggest excessive buying pressure. Values below 20 indicate potential selling exhaustion. Divergences between MFI and price offer powerful signals.
On-Balance Volume (OBV) and Chaikin Oscillator
On-Balance Volume (OBV) is a cumulative momentum indicator. It adds volume on up days and subtracts it on down days.
A rising OBV line confirms buying pressure. A falling line hints at distribution. Crosses above a moving average generate bullish signals.
The Chaikin Oscillator measures the momentum of the Accumulation/Distribution Line. It provides clear buy and sell signals when crossing its zero line.
Together, these volume indicators offer a complete view of market dynamics.
Advanced Techniques in Volume Analysis
Moving beyond basic indicators, advanced analysis provides a deeper layer of market intelligence. These methods reveal where and why significant activity occurs.
They help identify crucial support and resistance levels with greater precision. This knowledge is vital for anticipating future price action.
Volume Profile and Order Book Analysis
The Volume Profile is a powerful charting tool. It displays the total transaction amount at specific price levels over a period.
This differs from traditional indicators that track activity over time. High-volume nodes often become strong support or resistance zones.

Order book analysis examines live buy and sell orders on exchanges. Large buy orders, or “buy walls,” can indicate solid support.
Conversely, “sell walls” suggest potential resistance. Understanding this depth helps gauge immediate market sentiment for any asset.
Spotting Volume Spikes and Anomalies
Sudden, large increases in activity are called volume spikes. These often signal major events like breakouts or reactions to news.
It is crucial to distinguish genuine spikes from false ones. False spikes can result from wash trading or data errors on less reputable exchanges.
Combining these advanced tools with a solid understanding of technical analysis chart patterns creates a robust framework. This approach pinpoints where significant trading occurs and what it means for future prices.
Practical Strategies for Leveraging Volume in Trading
Applying volume data effectively transforms theoretical knowledge into a practical edge. This metric confirms the strength behind price movements and market sentiment.
It works best alongside other technical indicators. This combination strengthens the reliability of your decisions.

Integrating Volume with Technical Analysis
Volume acts as a powerful confirmation tool. It should not be used in isolation.
Look for activity spikes during breakout patterns. High volume validates the new price trend has momentum.
Monitoring activity over time is crucial. Declining activity during an uptrend suggests weakening momentum.
The table below outlines key strategies for combining volume with price action.
| Strategy | Volume Signal | Interpretation |
|---|---|---|
| Breakout Confirmation | Spike above average | High probability the breakout will sustain. |
| Trend Strength Check | Consistently high | The prevailing trend is strong and healthy. |
| Reversal Warning | Divergence (price up, volume down) | Potential trend exhaustion and reversal ahead. |
| Support/Resistance Test | High volume at a key level | Indicates whether the level will hold or break. |
Real-World Examples of Volume-Driven Moves
Historical events show the power of this analysis. Bitcoin’s 2021 surge to $64,000 was backed by massive activity.
This high volume validated the uptrend, indicating strong interest. Conversely, the May 2021 crash saw prices fall with intense selling pressure.
Ethereum’s rise in early 2023 is another clear example. Growing adoption fueled the movement, confirmed by strong activity.
These cases illustrate a core principle. Significant price shifts with high activity are more reliable.
Common Pitfalls and Market Manipulation in Volume Trading
While volume analysis offers powerful insights, the cryptocurrency landscape presents unique challenges that can distort this data. Awareness of these issues is crucial for accurate interpretation.

Recognizing Wash Trading and Unusual Volume Patterns
A significant threat to data integrity is wash trading. This manipulative practice involves simultaneous buying and selling to create a false impression of high activity.
Such artificial inflation misleads investors about true liquidity and interest. It erodes market integrity and distorts prices.
Key warning patterns include sudden spikes without news or price justification. Perfectly matched buy-sell orders are another major red flag.
The table below summarizes critical signs of potential manipulation.
| Signal | Description | Potential Meaning |
|---|---|---|
| Unexplained Spike | High volume with no fundamental cause. | Possible artificial activity to attract attention. |
| Price-Volume Divergence | Large price move with low participation. | Weak trend strength, potential false signal. |
| Round-Numbered Volume | Suspiciously even volume figures. | Could indicate automated, non-organic trading. |
Ensuring Data Integrity from Reputable Exchanges
Protecting yourself starts with selecting the right platforms. Prioritize well-established exchanges with strong security measures.
These platforms often comply with regulatory standards, reducing the risk of tolerated manipulation. Cross-reference information across multiple sources to verify data authenticity.
Healthy skepticism is your best defense. Extraordinary claims about trading volume require extra scrutiny. Always prioritize data quality over apparent market excitement.
Conclusion
Transaction flow analysis serves as a crucial compass for navigating the complex cryptocurrency landscape. This skill provides essential information about market strength and trend sustainability.
Understanding the relationship between price movement and transaction levels remains fundamental. High activity during upward trends signals strong bullish sentiment, while elevated volume during declines indicates selling pressure.
Successful investors integrate these insights with other technical tools and fundamental research. They remain vigilant against manipulation by using reputable sources.
Continuous learning and practice across different market conditions develop the experience needed to distinguish meaningful signals. For deeper understanding of crypto trading volume, ongoing education is essential for navigating this dynamic asset class with confidence.
FAQ
What exactly is cryptocurrency trading volume?
Trading volume represents the total number of coins or tokens traded on exchanges within a specific period, like 24 hours. It measures market activity and liquidity, showing how much interest exists in a particular asset.
Why is this metric so important for analyzing the market?
Volume provides crucial context for price movements. High levels often confirm the strength of a trend, while low levels can signal a lack of conviction. It helps investors gauge momentum and potential support or resistance levels.
How does price relate to volume in technical analysis?
The relationship is fundamental. A price increase on high volume suggests strong buying pressure and validates an uptrend. Conversely, a price drop on high volume indicates strong selling. Divergences between price and volume can warn of a potential trend reversal.
What are some essential volume-based indicators for traders?
Popular tools include the On-Balance Volume (OBV), which cumulatively adds or subtracts volume based on price closes, and the Money Flow Index (MFI), a momentum indicator that combines price and volume. The Chaikin Oscillator is another powerful tool for measuring accumulation and distribution.
How can I spot unusual activity or potential market manipulation?
Be wary of sudden, massive volume spikes on smaller assets that lack clear news catalysts. This can sometimes indicate wash trading or other manipulative practices. Always cross-reference data from reputable exchanges like Binance or Coinbase to ensure integrity.
Can volume analysis be used alone for making trades?
While incredibly valuable, it’s best used with other forms of technical analysis. Combining volume indicators with chart patterns, moving averages, and market sentiment provides a more robust and reliable trading signal.


No comments yet