Navigating digital asset markets requires more than chart patterns or social media hype. The fast-paced evolution of blockchain ecosystems creates complex challenges for traders. Rapid technological shifts and fragmented data streams often leave traditional investment strategies struggling to keep pace.
Blockchain transparency offers a distinct edge. Every wallet interaction and smart contract execution gets recorded publicly. This creates measurable insights into market sentiment, whale behavior, and network adoption trends that price charts alone can’t reveal.
Savvy traders now blend conventional technical analysis with real-time blockchain data. Tracking exchange inflows, staking activity, or token concentration helps identify opportunities before they reflect in prices. This fusion creates a clearer picture of supply-demand dynamics across crypto projects.
Mastering these techniques requires understanding key metrics like active addresses, transaction volume spikes, and holder distribution patterns. When combined with market context, this approach reduces reliance on speculation. It transforms raw data into actionable intelligence for strategic portfolio decisions.
Key Takeaways
- Blockchain transparency enables real-time tracking of market-moving transactions
- Combining on-chain data with traditional methods improves trade timing
- Wallet activity patterns reveal hidden supply-demand imbalances
- Network growth metrics help assess project viability
- Exchange flow trends signal potential price volatility
Understanding Cryptocurrency Analysis Fundamentals
Modern investors employ three distinct methods to evaluate digital assets. Established approaches from traditional finance merge with blockchain-specific techniques, creating a multi-layered evaluation system.
Traditional vs Blockchain-Specific Methods
Fundamental analysis scrutinizes project foundations like development teams and token distribution models. Investors examine whitepaper viability and adoption roadmaps to gauge long-term potential.
Technical analysis focuses on price charts and trading volumes. Patterns like moving averages or Bollinger Bands help predict short-term movements in volatile markets.
Essential Evaluation Criteria
Blockchain networks introduce critical new evaluation layers. These include:
- Real-time transaction verification rates
- Wallet activity concentration patterns
- Network growth versus price divergence
Traditional methods assess what’s traded, while on-chain data reveals who’s trading and why. This combination helps identify discrepancies between market sentiment and actual network usage.
Savvy strategists balance these approaches. They might use fundamental research to select assets, technical signals for entry timing, and blockchain metrics to confirm market momentum.
How to analyze cryptocurrency on chain metrics for investment decisions
What separates informed crypto decisions from guesswork? Blockchain’s immutable ledger holds answers through observable participant actions. Savvy strategists focus on ownership patterns and capital flows that signal market shifts before price reactions occur.

Pinpointing Ownership Influence
Token distribution tells a hidden story. When large wallets accumulate assets over weeks, it often precedes bullish momentum. Conversely, rapid transfers to exchanges typically indicate impending sell pressure. Tracking these movements requires filtering out exchange cold wallets and staking contracts.
Transaction Context Matters
Not all blockchain activity reflects market sentiment. A sudden spike in transactions might represent exchange housekeeping rather than user adoption. Effective analysis differentiates between protocol operations and genuine trading patterns through address labeling tools.
Three vital signals often get overlooked:
- Smart money wallets maintaining positions during price dips
- New address growth outpacing price appreciation
- Long-term holders increasing their stake percentages
These indicators help separate noise from actionable intelligence. By cross-referencing wallet clusters with historical behavior, traders identify high-probability setups. The key lies in consistent monitoring rather than reacting to isolated events.
Integrating Technical and Fundamental Crypto Analysis
Market participants often debate chart patterns versus project fundamentals. The real power emerges when combining these methods. Traders gain both market timing precision and long-term conviction through strategic integration.

Insights from Price Charts and Patterns
Price movements tell stories through recurring formations. Support levels show where buyers historically defend prices, while resistance marks selling pressure zones. Breakouts from consolidation patterns often signal momentum shifts.
Volume confirms trend validity. A rally with shrinking participation suggests weak conviction. Moving averages smooth volatility, highlighting underlying trends. The RSI oscillator flags extremes – readings above 70 may indicate overbought conditions.
Assessing Tokenomics and White Papers
Project fundamentals determine staying power. Whitepapers reveal technological ambition and implementation roadmaps. Strong teams balance technical expertise with real-world adoption strategies.
| Factor | Technical Approach | Fundamental Approach |
|---|---|---|
| Focus | Price action & market psychology | Project viability & token utility |
| Key Tools | Chart patterns, volume analysis | Whitepaper review, supply metrics |
| Time Horizon | Days to weeks | Months to years |
Effective strategies merge these perspectives. Chart signals guide entry points, while tokenomics ensure sustainable potential. This dual lens filters noise from genuine opportunities in volatile markets.
Leveraging On-Chain Data for Enhanced Trading Strategies
Market shifts often leave traces in blockchain records before appearing on price charts. Savvy traders use these breadcrumbs to refine their approaches, combining live network statistics with traditional market signals.

Monitoring Active Addresses and Transaction Volume
Active addresses reveal user participation trends. A rising count suggests growing network adoption, while declines may signal waning interest. Transaction volume separates genuine usage from speculative noise – sustained increases often precede price movements.
| Metric | Purpose | Data Source |
|---|---|---|
| Active Addresses | Measure user engagement | Block explorers |
| Transaction Count | Track network utilization | Node APIs |
| Exchange Inflows | Detect selling pressure | Exchange wallets |
| Hash Rate | Assess security strength | Mining pools |
| Wallet Age | Identify holder behavior | UTXO analysis |
Tracking Exchange Flows and Network Health
Exchange movements act as market thermometers. Large deposits often precede price drops, while withdrawals suggest accumulation. Platforms offering on-chain analysis techniques help decode these patterns effectively.
Network security metrics like hash rate prove crucial during volatile periods. A robust infrastructure attracts institutional interest, creating positive feedback loops. Traders monitor validator participation to gauge decentralization levels – key for long-term project viability.
Combining these elements creates dynamic strategies. Real-time alerts for unusual exchange activity or network congestion help traders stay ahead. This approach transforms raw data into tactical advantages across market conditions.
Extracting Insights from Top Holder and Smart Money Trends
Successful crypto strategies often hinge on understanding key players’ moves. Observing wallet activity patterns reveals hidden market forces that shape price trajectories. Savvy traders track both token distribution and influential investors to anticipate shifts.

Analyzing Holder Distribution and Concentration
Token allocation patterns expose critical risks and opportunities. Projects like Pendle demonstrate how institutional participation often reflects quality – Spartan Group and Arthur Hayes accumulated positions during market lows. Excessive concentration among few wallets raises manipulation risks, as seen when 40% of a token’s supply sits in five addresses.
| Factor | Holder Distribution | Smart Money Movements |
|---|---|---|
| Focus | Supply allocation & ownership spread | Institutional accumulation patterns |
| Key Indicators | Top 10 wallet balances | Exchange inflow/outflow ratios |
| Risks | Coordinated sell-offs | False accumulation signals |
| Data Sources | Blockchain explorers | Labeled address trackers |
Understanding Smart Money Movements
Sophisticated investors often telegraph market turns through strategic positioning. Hayes’ 500,000 PENDLE acquisition preceded a 300% price surge, while Spartan’s Binance transfers signaled profit-taking. Tracking these movements helps differentiate between temporary dips and fundamental weakness.
Three critical patterns emerge:
- Long-term holders increasing stakes during volatility
- Exchange withdrawals exceeding deposits for 7+ days
- Smart wallets maintaining positions through corrections
These signals create actionable alerts when combined with trading volume analysis. They help investors separate noise from genuine accumulation phases in fast-moving markets.
Using On-Chain Data in Fundamental Analysis
Blockchain networks transform how investors assess digital asset potential. While traditional methods focus on whitepapers and team credentials, on-chain data reveals real-world application through measurable engagement patterns. This shift enables quantitative validation of project claims that once relied solely on qualitative judgment.
Evaluating Tokenomics and User Activity Growth
Total Value Locked (TVL) serves as a critical health indicator for DeFi protocols. Platforms with consistent TVL increases demonstrate actual capital commitment rather than speculative hype. Examining top depositors within these systems helps identify smart money participation – a strong validation signal when reputable institutions appear.
Three core metrics redefine project evaluation:
- Daily active addresses showing organic network usage
- Transaction volume patterns confirming utility adoption
- Holder distribution shifts indicating long-term confidence
Projects like Aave and Compound demonstrate how sustained user activity growth correlates with price stability. Their on-chain records show consistent transaction counts even during market downturns, proving real-world utility beyond token speculation.
Tokenomics models gain credibility when paired with blockchain evidence. A well-designed supply mechanism means little without observable holder behavior matching its incentives. Network expansion metrics provide early warnings when development milestones fail to materialize as promised in roadmaps.
Historical data trends become crucial for assessing value propositions. Protocols maintaining three-month upward trajectories in both addresses and transactions often outperform those with sporadic spikes. This approach filters temporary hype from genuine ecosystem development.
Interpreting Technical Analysis for Crypto Trading
Chart patterns act as market fingerprints, revealing hidden buyer-seller dynamics. Technical analysis deciphers these clues through price action and volume trends. While crypto markets move fast, recurring formations help traders spot high-probability setups.
Core Components of Price Evaluation
Support and resistance levels form market memory points. These zones show where price historically reversed direction. A breakout above resistance often signals bullish momentum, while breakdowns below support indicate weakening demand.
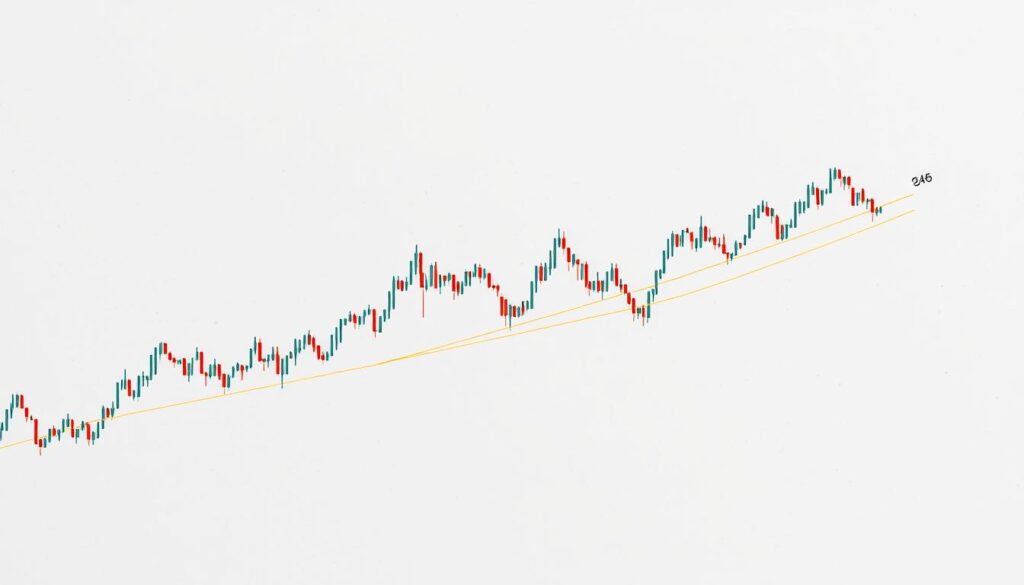
Trend lines connect swing highs/lows to visualize market direction. Rising lines suggest accumulation phases, while descending slopes reveal distribution. Breakouts from these patterns frequently precede substantial price movements.
| Indicator | Purpose | Common Signals |
|---|---|---|
| RSI (14-day) | Measure momentum extremes | Overbought (>70), Oversold ( |
| 50 EMA | Identify short-term trends | Price above = bullish bias |
| Volume Spikes | Confirm breakout validity | +50% volume on resistance breaks |
Moving averages smooth volatility. The 50-day EMA reacts faster to price changes than the 200-day SMA. Crossovers between these lines often mark trend reversals.
Combining these tools with market sentiment data strengthens predictions. For example, oversold RSI readings during positive news flow may signal buying opportunities. This fusion helps traders separate false signals from genuine trend changes.
Applying Real-World Case Studies in Crypto Analysis
Practical examples demonstrate how blockchain data transforms speculation into strategy. The Pendle ecosystem reveals patterns that savvy traders used to anticipate major price movements while others hesitated.
Case Study: Analyzing Pendle’s On-Chain Activity
Institutional players like Spartan Group accumulated PENDLE tokens 2-7 months before its 300% surge. Despite recent profit-taking by Apollo Capital, top holders continue staking in vePendle pools – a strong confidence signal. This behavior pattern helped investors spot accumulation phases during market dips.
Three key insights emerged:
- Smart money addresses increased holdings during consolidation periods
- Staking activity indicated long-term commitment despite price volatility
- Recent sell pressure coincided with new large purchases
Setting Up Smart Alerts for Market Changes
Real-time monitoring tools help traders capitalize on shifting market conditions. Custom alerts for exchange inflows, whale movements, and staking changes create decision-making advantages. Platforms tracking these metrics enable faster reactions than manual analysis.
Effective alert systems consider:
- Token concentration changes among top wallets
- Divergences between price and network growth
- Unusual transaction patterns across time zones
Combining case studies with automated monitoring helps decode complex crypto market shifts. This approach turns historical patterns into proactive decisions, giving participants an edge in fast-moving digital asset markets.


No comments yet