
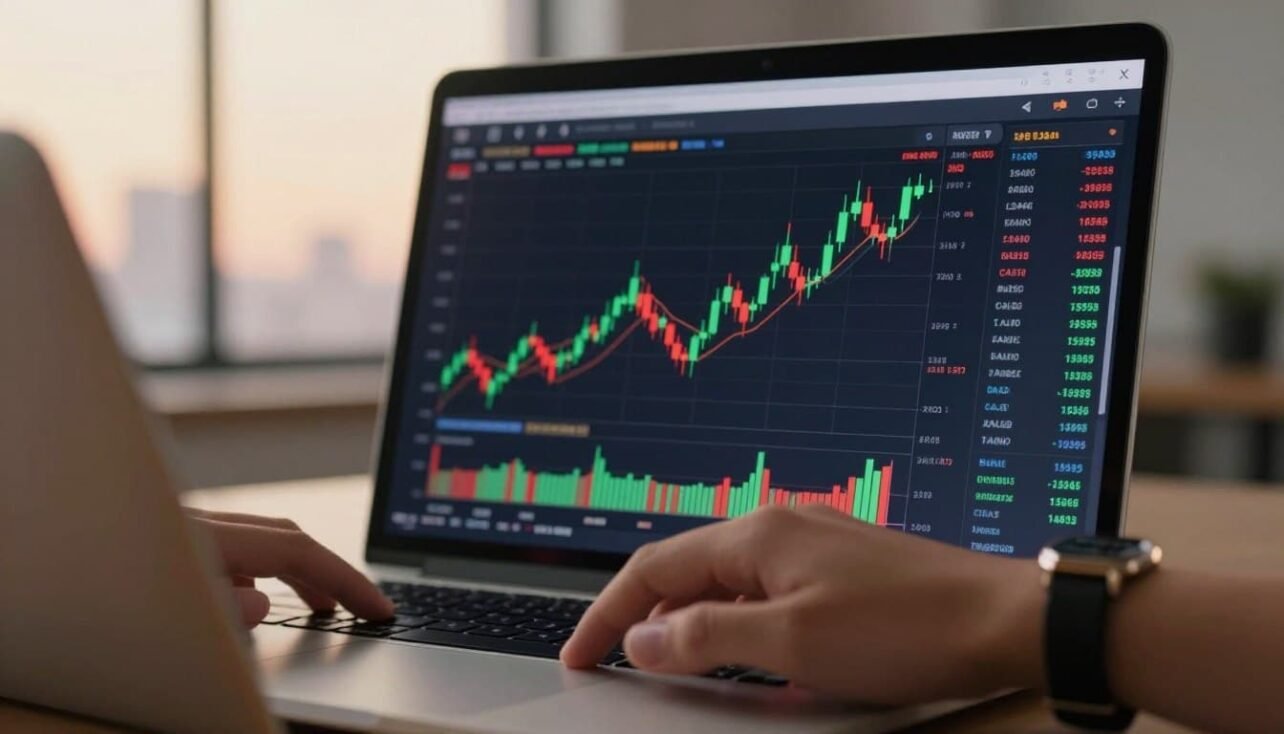
Candlestick charts pack price moves into clear shapes that show opening, high, low, and close values. Traders rely on these visuals to gauge market mood quickly and act on short windows of change.
This guide explains the basic anatomy of a candlestick and the timeframes you will use. You will learn how bodies and wicks reveal buying or selling pressure, and why those signals matter for coins like BTC and ETH.
Expect practical steps: single-, two-, and three-bar patterns, continuation setups, and ways to confirm signals with simple indicators. Remember, patterns show probabilities and crowd behavior, not guarantees.
Focus is on analysis and decision-making, not promises of easy gains. With clear rules and indicator checks, you can read price action faster and make more informed trading choices in a market that never sleeps.
Why candlestick charts matter in crypto markets today
Crypto markets move fast, and clear visuals help traders spot momentum before it fades. Large swings and frequent wick spikes change how price action reads on each period. That makes quick visual summaries more useful than raw trade prints when you need a snapshot of market sentiment.
Volatility can produce wide candle ranges and many rejection wicks. Since markets run 24/7, classic open/close gaps are rare; traders rely more on closes and follow-through candles for confirmation.

Liquidity also shapes candle form. Thin order books or weekend flows cause slippage and long wicks, especially on smaller tokens. DEX venues use AMM pools and pool depth, while CEX platforms use bid/ask ladders in order books. Each venue creates different price fingerprints on charts.
- Why traders use charts: quick sentiment, momentum clues, and easy period comparisons.
- Pick the right period: 1m, 15m, 1h, 1D, or 1W changes the story the chart tells.
These visuals give a faster analysis of price action than a simple line, and set up the next section for a closer look at what each candle reveals.
What a candlestick chart shows at a glance
Each candle packs four price points into a fixed slice of time and gives a fast snapshot of session action. One candle equals one period and holds open, high, low, and close data for that time bucket.

Time-based segments and what a “period” means
A period is a fixed time bucket on a chart. A 5-minute period looks very different from a daily one for the same asset.
Consistency in timeframe matters when you compare patterns. Pick a period and stick with it when judging trends or runs of candles.
Why candlesticks beat line charts for quick market sentiment
Candlesticks show direction, intraperiod volatility, and conviction. Long bodies signal strong price moves. Long wicks show rejection or fast swings.
- Direction: buyers or sellers won the period.
- Volatility: wick length reveals intraperiod highs and lows.
- Conviction: body size shows how decisive the move was.
Line charts hide highs and lows and strip context from reversals. Use candles with volume and support/resistance for better analysis and clearer market clues. For a deeper primer, see this candlestick guide.
Candlestick anatomy explained using OHLC data
A single candle packs four price points that tell the short story of a trading period.
Open marks where the period began and the closing price marks where it ended. The body is the space between open and close and shows which side won that session.
 data. Each candlestick should have distinct colors to indicate bullish (green) and bearish (red) trends. In the middle layer, incorporate a soft gradient background in shades of blue to represent a calm trading environment. The lighting should be bright and diffuse, emphasizing the textures of the candlesticks. The perspective should be slightly elevated for a comprehensive view, creating an informative and engaging mood suitable for educational purposes. The image must be clean with no text or logos present.")
Open price vs. closing price and what the body reveals
When the close is above the open, the body is bullish. That green candle signals buyers moved price higher during the period.
When the close sits below the opening level, the body shrinks or flips color. A red candle shows sellers held control.
High price and low price: reading wicks (shadows) correctly
Wicks mark intraperiod extremes. The upper wick shows the high price and any rejection above. The lower wick shows the low price and rejected dips.
Long wicks mean tested levels, not automatic reversals. Context and nearby closes matter for confirmation.
Green candle vs. red candle: bullish and bearish sessions
Color rules vary by platform, but meaning stays the same: green candle for bullish moves, red candle for bearish ones. Buyers and sellers fight inside every candle; the body and wicks record who pushed and who gave way.
- Quick tip: trust the close for confirmation, not a single long wick.
How to Read Candlestick Charts in Crypto for buying and selling pressure
A candle’s size and shape reveal which side—buyers or sellers—held sway during that period. Use body length and close position as the first clue for momentum.

Long bodies: clear conviction
Long bodies usually indicate strong buying or strong selling pressure. A large bullish body that closes near the high often indicates strong buying.
Conversely, a long red body that closes near the low shows heavy selling pressure and fast participation by sellers.
Short bodies: market pause
Short bodies mean indecision. Neither side won the period, and the market may be pausing before a breakout or reversal.
Wicks and rejection
A long upper wick suggests sellers rejected higher prices; a long lower wick shows buyers defended support. Watch for wick symmetry and what came just before the candle.
- Checklist: body length, close location, wick size, prior candles.
- Warning: crypto creates wick traps—seek confirmation on the next candle or higher timeframe.
Choosing the right timeframe for your trading style
Picking the right timeframe changes how often signals arrive and how clean those signals look.
Short-term charts for day traders
Short windows (1-minute up to 1-day) give many signals but carry more noise. Fast setups can work for active trading, but noise raises false positives.
Use strict rules, clear stop levels, and a higher chart for bias. One candle on a short period contains quick, small price action and less context.
Medium-term charts for swing trading
Daily to weekly periods offer fewer signals and clearer setups. That makes reversal and trend analysis more reliable for multi-day holds.
Fewer false signals mean traders can place wider stops and focus on structural moves in the market.
Long-term charts for investors
Weekly to monthly views show major trend and broad price structure. These charts filter intraday spikes and keep you from being shaken out by wicks.
Align your holding period with the chart you use: bias on a higher timeframe, entries on a lower one. This pairing helps match risk tolerance and improve analysis before acting.
- Quick checklist: signal frequency, false positives, holding period, entry timeframe, bias timeframe.
How to identify trend direction and market structure with candles
Market structure becomes clear when you track how candles form higher and lower swings. That sequence of swings and closing levels gives a simple roadmap for trend and trend shifts. Use this roadmap before you act on a trade.
Uptrend: higher closes and higher highs and lows. A string of these candles shows buyers gaining control and price moving in one direction.
Downtrend: lower closes and lower highs and lows. Repeated lower closes show sellers driving the market and pressure likely to continue.
Sideways: closes that cluster between a clear high and low create consolidation. The market is deciding its next major move.
Sequences beat single signals. Crypto whipsaws on news and liquidations, so look for runs of candles confirming a direction rather than one big wick.
- Mark support with prior lows and long lower wicks near those points.
- Mark resistance with prior highs and repeated failures to close above them.
- Why close matters: a close above or below a zone shows acceptance; a wick touch does not.
Think of market structure as a story of impulse moves and pullbacks. Identify trend on a higher timeframe, then zoom in and use candle behavior for cleaner entries. Many classic patterns are simply shorthand for these swing changes.
Single-candle signals every beginner should recognize
A lone candle can carry a powerful message about market intent if you check its context. Single-bar signals offer quick clues, but they only become useful when placed against trend, key levels, and a confirming follow-up candle.
Doji: indecision, not an instant reversal
A Doji forms when open and close are nearly the same, leaving a very small body. It shows market indecision and can mark a pause rather than a reversal. Check where the Doji appears—at a support, resistance, or mid-trend—for clues.
Hammer: buyers step in after a drop
A valid Hammer has a small body near the top and a long lower shadow (often 2x the body) after a downtrend. That long lower wick suggests buyers defended the area. Look for a bullish follow-through candle for greater reliability.
Shooting star: selling pressure near a top
The shooting star shows a small body near the low and a long upper shadow at least twice the body. It often appears after an uptrend and signals selling pressure as buyers fail to hold higher prices. Use trend direction and nearby resistance as filters.
- Rule: single candles hint at reversals but need confirmation from the next candle or a higher timeframe.
Two-candle candlestick patterns that signal potential reversals
Watching a pair of candles often exposes real momentum changes that single bars hide. Two-bar formations show a shift across consecutive closing price points and help confirm a true change in control between buyers and sellers.
Bullish engulfing
A small first candle in a downtrend is followed by a larger bullish body that fully engulfs it. The bullish engulfing pattern signals that buyers took control after selling pressure. Traders look for a higher close or volume confirmation as follow-up.
Bearish engulfing
After an uptrend, a long red second candle can overwhelm the prior body. A clear bearish engulfing often signals a potential reversal near resistance because sellers pushed price past the first candle’s range.
Harami pattern
The Harami pattern shows a much smaller body contained inside the first candle. It marks compression or hesitation and can hint at a reversal after extended moves, especially when it sits at a key level.
Piercing line
A piercing line follows a long red candle with a strong bullish response that reaches above the prior midpoint. Traders wait for the next close or volume alignment for reliable confirmation in 24/7 markets.
- Quick framework: identify trend → mark level → spot pattern → confirm with next candle or indicator.
- Crypto note: focus on closes and volume rather than textbook gaps.
Three-candle setups and the three-candle rule in crypto
A simple three-candle rule can cut false signals by demanding a clear close in the new direction. In short, the rule uses a trend candle, an indecision candle, and a confirmation candle. The focus is the close of the third candle as the main sign of a reversal.
Morning star: bullish setup after a downtrend
The Morning star appears after a downtrend and signals sellers losing momentum. The first candle extends the drop, the second shows indecision, and the third closes upward with strength. This pattern often means buyers stepped in and price may start rising.
Evening star: bearish setup after an uptrend
The Evening star is the mirror image after an uptrend. The first candle is strong bullish, the second is small and unsure, and the third closes decisively lower. It suggests buyers stalled and sellers gained control.
Using the first candle and third candle for confirmation
Compare body size and close location between the first candle and the third candle. A larger third body that reclaims or breaks key levels offers better confirmation than a weak close. In a 24/7 market, gaps may be minimal, so prioritize follow-through closes over textbook spacing.
- Tip: align any three-candle pattern with nearby support or resistance to reduce false reversal signals.
- Note: these setups relate to engulfing ideas like bullish engulfing and bearish engulfing but add clearer confirmation with the middle candle.
Continuation patterns that can help traders stay with the trend
Some formations help traders stay with a move by flagging temporary pauses. A continuation means the market rests, volatility compresses, then the prevailing trend often resumes. That simple idea keeps traders from selling out on normal pullbacks.
Spinning top: consolidation and fading momentum
A spinning top has a short body centered between similar wicks. It signals indecision and fading momentum rather than an automatic reversal.
Use it as a wait signal: let the next close or a breakout of the candle range confirm direction before acting.
Rising three methods and falling three methods: pause patterns inside a trend
Rising three methods show a strong bullish candle, a series of small countertrend candles contained inside the dominant range, then a bullish resumption. Falling three methods mirror this for bearish moves.
- Rule: the countertrend candles must stay within the containment range.
- Risk: invalidate the pattern when prices break that range; place stops beyond the containment high/low.
- Benefit: these patterns help traders remain with the trend instead of exiting on normal pullbacks.
For more pattern examples and applied signals, see this continuation patterns guide.
Confirming candlestick signals with technical indicators and tools
Combine visual patterns with measured indicators to separate real moves from noise. Treat candlestick patterns as signals that require confirmation — indicators, Not Oracles. Use them for added evidence, not absolute proof.
Moving averages
Simple and exponential moving averages (SMA/EMA) define trend direction and act as dynamic support or resistance. A candle signal near a rising 50 EMA gains weight as a trend confirmation.
RSI basics
The Relative Strength Index (14) reads 0–100. Readings above 70 hint at overbought conditions; below 30 hint at oversold. A reversal pattern that lines up with an RSI exit from extreme zones is more compelling.
Bollinger Bands and volatility
Bollinger Bands (20, ±2) map volatility. Band contraction signals low volatility; expansion can foreshadow breakouts. Candles touching the outer band may mean momentum or a mean reversion — watch the next close.
Volume confirmation
Volume validates move strength. High volume on a breakout or engulfing candle suggests real participation. The same candle on low volume is less trustworthy in a thin market.
Fibonacci retracements
Map a swing high and low and watch common retrace levels (23.6%, 38.2%, 50%, 61.8%, 78.6%). Look for candle confirmation near these zones before assuming a reversal.
Ichimoku Cloud overview
Ichimoku blends trend, momentum, and support/resistance. Price above the cloud signals bullish trend; below signals bearish. Crosses of Tenkan/Kijun and the Chikou span give extra confirmation.
- Rule: use one trend tool + one momentum/volatility tool + volume to reduce conflicting signals.
- Tip: always align pattern analysis with higher timeframe trend and clear support/resistance.
- Further reading: see a short primer on signal confirmation for beginners here.
Conclusion
Understanding candle shape and closing behavior reveals who has control of price and when that control shifts. Read each candle’s body and wicks as compact data that show sentiment and short-term momentum.
Use a simple workflow: pick a timeframe, identify trend, mark levels, spot a pattern, then confirm with volume and indicators before acting. This repeatable approach helps traders limit false signals in a volatile market.
Practice by replaying historical charts, labeling setups, and tracking outcomes. Over time, this builds pattern recognition and timing for entries and exits.
Takeaway: mastering candlestick reading is about consistent interpretation of price action, not memorizing names, so focus on context, confirmation, and risk management.
FAQ
What information does a candlestick give me at a glance?
A candlestick shows four OHLC data points for a chosen period: open, high, low, and close. The body (distance between open and close) shows buying or selling control, while wicks reveal rejection levels. Together they summarize price action and short-term sentiment.
Why do candlesticks matter for crypto traders now?
Crypto markets run 24/7 and can swing fast. Candlesticks compact time-based moves into readable units, helping traders spot momentum shifts, reversals, and support/resistance areas amid high volatility and varying liquidity on DEX pools and CEX order books.
How does timeframe choice affect candle interpretation?
Short-term charts expose fast signals and noise useful for day trading. Medium-term charts smooth intraday volatility for swing trades. Long-term charts emphasize trend direction and filter out spikes that don’t matter for investors. Match timeframe to strategy.
What does a long green or long red candle indicate?
A long green (bullish) candle suggests strong buying pressure and a decisive close above the open. A long red (bearish) candle signals strong selling pressure and a close below the open. Both require context like nearby support, resistance, and volume.
When should I treat short-bodied candles as important?
Short bodies show indecision or a pause in momentum. If they appear after an extended move, they can warn of weakening trend or pending reversal, especially when paired with long wicks or high volume. Context is key.
What does a long upper wick or long lower wick tell me?
A long upper wick indicates price rejection at higher levels and possible selling pressure. A long lower wick shows rejection at lower levels and potential buyer strength. Use these wicks to spot rejection or support zones.
How do I spot trend direction with candle sequences?
Look for higher highs and higher lows for an uptrend, lower highs and lower lows for a downtrend, and overlapping ranges for sideways action. Consecutive strong bodies in one direction confirm momentum; mixed candles signal consolidation.
Which single-candle patterns should beginners memorize?
Start with Doji (indecision), Hammer (bullish after a decline), and Shooting Star (bearish at highs). These are simple rejection indicators but must align with trend context and confirmation from subsequent candles.
What does a bullish engulfing pattern mean?
A bullish engulfing occurs when a green candle fully covers the prior red body, suggesting buyers regained control. It’s more reliable after a downtrend and with rising volume or confirming closes on following candles.
What is a bearish engulfing and how serious is it?
A bearish engulfing forms when a long red candle engulfs the prior green body, indicating sellers overwhelmed buyers. It often signals a reversal after an uptrend, especially with a long red body and increased volume.
How do three-candle setups like the morning star work?
Three-candle patterns use a first candle showing momentum, a small middle candle signaling indecision, and a third candle confirming a shift. Morning star signals bullish reversal after a decline when the third candle closes into the first candle’s body.
How can I confirm candlestick signals with indicators?
Use moving averages for trend context, RSI for overbought/oversold warning, Bollinger Bands for volatility, volume to validate strength, and Fibonacci levels for likely pullback zones. Combine signals rather than relying on one candle alone.
Should I interpret patterns differently on DEX liquidity pools vs. CEX order books?
Yes. DEX liquidity can produce choppier candles and larger slippage, while CEX order books may show cleaner price levels. Adjust expectations for wick length, volume, and false breakouts based on venue and liquidity depth.
How important is the closing price when assessing a candle?
The close is often the most important price in a candle because it reflects final control during the period. A close near the high suggests buyer dominance; a close near the low indicates seller dominance. Use close location with wicks and volume for signals.
No comments yet