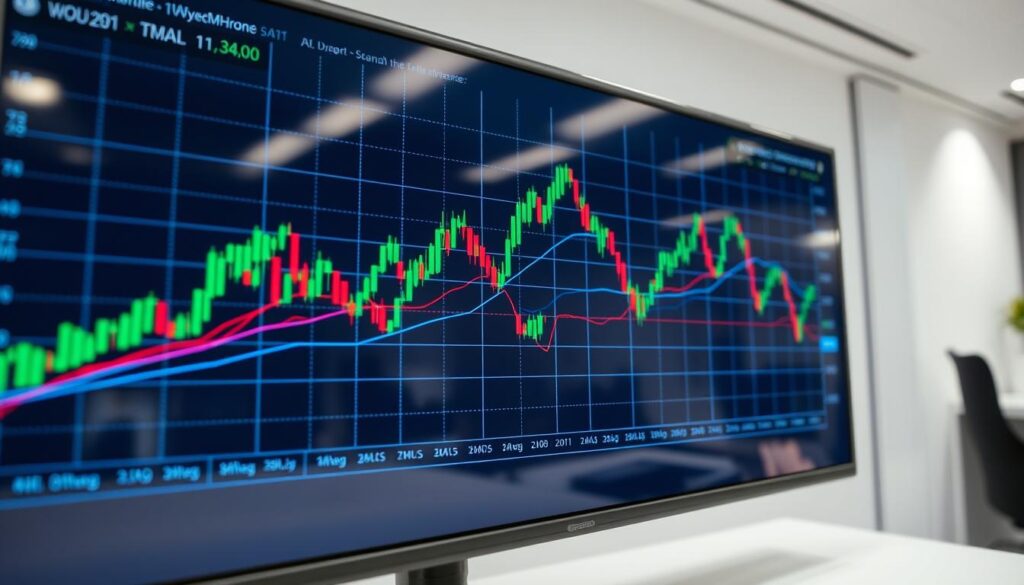
Cryptocurrency markets present unique challenges for participants. The extreme volatility can make trend identification difficult. Technical analysis tools help filter out market noise and reveal underlying patterns.
Among these tools, moving averages stand out as fundamental indicators. They smooth price data by calculating average values over specific periods. This creates clearer trend lines that guide decision-making.
This comprehensive guide explores practical applications of these calculations. Both new and experienced traders benefit from understanding these methods. The approach works across various digital assets like Bitcoin and Ethereum.
Market participants can apply these techniques to different timeframes. Short-term and long-term analysis both provide valuable insights. The strategies help determine optimal entry and exit points.
Professional traders worldwide rely on these foundational principles. They form the basis for more advanced crossover systems. Understanding these concepts provides clarity during rapid price movements.
Key Takeaways
- Moving averages help filter out market noise in volatile cryptocurrency environments
- These indicators smooth price fluctuations by calculating average values over time
- Both beginner and experienced traders can benefit from this technical analysis method
- The approach works across different timeframes and various digital assets
- These calculations serve as foundation for more advanced trading strategies
- Market participants gain clearer trend identification for better decision-making
- Professional traders worldwide utilize these methods for entry and exit timing
Introduction to Moving Averages in Crypto Trading
Digital currency charts benefit from indicators that smooth erratic movements. These calculations create lines representing average values over time periods. This visualization helps identify underlying direction despite short-term fluctuations.
Defining Moving Averages and Their Role in Trading
A moving average calculates mean price across a defined number of periods. For example, a 20-period line sums twenty previous closing values then divides by twenty. This creates a continuous line that filters out minor price swings.
The primary purpose involves revealing the broader market direction. It allows participants to focus on significant movements rather than noise. This is particularly valuable in environments with rapid price changes.
Markets naturally exhibit mean reversion behavior. Prices tend to return toward their average after deviations. These indicators serve as dynamic reference points for this equilibrium-seeking action.
Benefits and Limitations in a Volatile Market
These tools offer several advantages for analyzing digital assets. Trend identification becomes clearer when short-term volatility is reduced. The lines also function as dynamic support and resistance levels.
However, these calculations have inherent limitations. They are lagging indicators that confirm established patterns rather than predict future movement. Sideways markets can generate false signals that may lead to losses.
| Advantages | Considerations |
|---|---|
| Filters market noise effectively | Responds slowly to rapid price changes |
| Identifies trend direction clearly | Can produce false signals in choppy conditions |
| Provides dynamic support/resistance | Works best with complementary indicators |
These technical tools deliver maximum value when combined with other analysis methods. Proper risk management remains essential when implementing any strategy. The approach helps participants make more informed decisions in turbulent conditions.
Understanding the Types of Moving Averages
Different mathematical approaches exist for smoothing price data over time. Each method offers unique characteristics for trend analysis. Traders select these calculations based on their strategy requirements.
Simple Moving Average (SMA)
The SMA represents the most straightforward calculation method. It assigns equal weight to all periods in the calculation. For three periods at $50, $45, and $60, the SMA equals $51.66.
This approach creates smooth lines ideal for long-term trend identification. The equal weighting makes it less responsive to recent price changes.
Weighted Moving Average (WMA)
WMA applies linear weighting to price data. Recent periods receive greater importance in the calculation. Using the same three prices, WMA yields $50.
This method responds faster than SMA but slower than EMA. It serves as a middle ground for traders seeking moderate responsiveness.
Exponential Moving Average (EMA)
EMA employs exponential weighting through a smoothing multiplier. For a 3-period calculation, the multiplier is 0.5. This gives dramatic importance to recent price action.
The same three prices produce an EMA of $51.25. This type reacts quickest to market movements, making it popular for short-term strategies.
| Calculation Type | Responsiveness | Best Application |
|---|---|---|
| Simple Moving Average (SMA) | Slowest | Long-term trend identification |
| Weighted Moving Average (WMA) | Moderate | Balanced timeframes |
| Exponential Moving Average (EMA) | Fastest | Short-term trading signals |
Each calculation type serves distinct purposes in market analysis. The choice depends on timeframe preferences and risk tolerance. Understanding these differences enhances technical analysis effectiveness.
how to use moving averages crypto trading
Parameter configuration plays a crucial role in maximizing the effectiveness of trend analysis indicators. Proper settings transform basic calculations into powerful decision-making tools.
Choosing the Right Settings for Short-Term and Long-Term Trends
Longer timeframes provide stronger, more reliable signals. Daily charts offer greater significance than fifteen-minute views.
Higher period calculations indicate broader market direction. A 200-day setting reflects annual trends, while 50-day captures medium-term movements.
| Timeframe | Signal Strength | Primary Application |
|---|---|---|
| Daily/Weekly | Strongest | Long-term position analysis |
| 4-Hour/12-Hour | Moderate | Swing trading strategies |
| 1-Hour/15-Minute | Weaker | Intraday decision-making |

Adapting Parameters to Different Market Timeframes
Platforms allow easy customization through indicator menus. Access the function symbol to add calculations to your view.
Combine multiple period settings for comprehensive perspective. This approach reveals both immediate and sustained direction.
Active participants prefer shorter periods like nine or twenty. Position-focused individuals typically employ hundred or two hundred day settings.
Implementing Trend Analysis with Moving Averages
The slope and position of trend lines offer immediate insights into market momentum and direction. These calculations transform raw price data into actionable information for participants.
Market phases become clearer when analyzing the relationship between current values and historical averages. This approach helps filter out temporary fluctuations.
Identifying Uptrends, Downtrends, and Sideways Movements
A rising indicator line signals bullish conditions with prices consistently above the average. This configuration suggests buyer dominance in the market.
Declining lines indicate bearish pressure when values remain below the calculation. Sideways action occurs when price oscillates around the line without clear direction.
| Market Condition | Price Position | Indicator Slope | Trading Implication |
|---|---|---|---|
| Uptrend | Above average | Upward | Bullish momentum |
| Downtrend | Below average | Downward | Bearish pressure |
| Sideways | Crossing average | Flat | Range-bound action |

Utilizing Crossovers as Trading Signals
Crossovers occur when shorter-period calculations intersect longer-term ones. A bullish signal appears when the faster line crosses above the slower line.
The Golden Cross represents a significant bullish event with the 50-period crossing above the 200-period. Conversely, the Death Cross indicates potential bearish reversal.
These patterns work best in trending markets rather than choppy conditions. For comprehensive guidance on these techniques, explore this moving averages trading guide.
Combining Multiple Indicators for Enhanced Decision-Making
Sophisticated market participants combine multiple technical indicators for enhanced decision-making. This approach creates more robust strategies that reduce false signals. The integration provides greater confidence in entry and exit timing.
Integrating Support and Resistance with Moving Averages
These calculations often function as dynamic support and resistance levels. Price frequently bounces off major lines like the 100-day or 200-day settings. This creates logical zones for protective orders and potential entries.
A support level forms where buyers consistently enter the market. This occurs when price approaches a rising calculation. The level acts as a floor preventing further declines.
Resistance appears during downtrends when sellers defend certain price areas. A declining line acts as a ceiling that causes reversals. These patterns offer clear risk management opportunities.

Augmenting Analysis with Volume, RSI, and Other Tools
Volume confirmation adds strength to breakout signals. High volume during crossings indicates greater validity. Low volume moves often result in quick reversals.
Momentum oscillators like RSI provide additional context. They confirm whether signals occur in overbought or oversold conditions. This combination creates higher probability setups.
Professional traders wait for multiple indicators to align before committing capital. Signal accumulation involves crossovers coinciding with volume increases and RSI confirmation. This comprehensive approach filters out market noise effectively.
Developing Effective Trading Strategies Based on Moving Averages
Systematic approaches to position management provide structure amid chaotic price action. These methodologies help participants make consistent decisions across various market conditions.
Trend Following and Crossover Techniques
Double calculation crossovers create clear entry and exit signals. A fast EMA crossing above a slower one indicates bullish momentum. The opposite crossover suggests bearish conditions.
Triple alignment strategies add confirmation layers for higher reliability. Short, medium, and long-term averages must align before position entry. This approach reduces false signals significantly.

Ribbon configurations display multiple periods simultaneously. Expanding ribbons indicate strong trends, while compression suggests consolidation. Visual cues help timing decisions.
Managing Whipsaws and False Signals
Range-bound markets create repeated crossovers without sustained direction. These whipsaw patterns can trigger multiple losing trades. Higher period settings smooth out this noise effectively.
Risk management becomes essential during uncertain conditions. Stop-loss orders placed beyond supporting averages protect capital. Position sizing ensures single losses remain manageable.
Additional confirmation from volume or momentum indicators enhances signal quality. Avoiding obvious consolidation periods prevents unnecessary exposure. These techniques create more robust approaches.
Leveraging Advanced Trading Platforms and Tools
Advanced charting tools transform traditional market analysis through sophisticated automation features. These platforms streamline the entire technical analysis process from setup to execution.
Modern applications like Good Crypto offer comprehensive indicator management across multiple exchanges. Traders benefit from fee-free access to automated systems including DCA, Grid, and Infinity Trailing bots.
Automating Indicator Settings and Strategy Execution
Platforms simplify indicator configuration through intuitive interfaces. Adding calculations involves tapping the fx symbol in the menu. Settings customization occurs by selecting three dots or double-tapping the indicator.
Programmable orders create conditional trading scenarios for enhanced efficiency. For example, a Bitcoin buy order at $40,000 can automatically trigger stop-loss at $38,000 and take-profit at $50,000.
AI-driven systems analyze multiple averages and oscillators simultaneously. GoodCrypto Signals evaluates coins using fifteen different calculations and ten momentum tools. This comprehensive approach predicts price trends with greater accuracy.
Automated alerts notify participants when specific conditions occur. Daily market overviews and programmed notifications eliminate constant chart monitoring. These features ensure timely responses to emerging opportunities.
Conclusion
The journey toward consistent trading results begins with mastering fundamental analytical tools. These calculations serve as essential instruments for market participants at all experience levels.
SMA, EMA, and WMA each offer distinct advantages for different timeframes and strategies. Proper period selection aligns with individual objectives, from long-term position analysis to short-term signal generation.
Remember that these indicators work best when combined with complementary tools and rigorous risk management. They provide directional context rather than perfect predictions.
Continuous practice and application build confidence in interpreting these valuable signals. This comprehensive guide offers the foundation for developing personalized approaches to market analysis.
FAQ
What is the main difference between a Simple Moving Average (SMA) and an Exponential Moving Average (EMA)?
The key difference lies in how they weight price data. An SMA gives equal weight to all prices in the period. An EMA places more importance on recent price action. This makes the Exponential Moving Average more responsive to new market information.
How can I use moving averages to identify support and resistance levels?
In technical analysis, a moving average can often act as a dynamic support or resistance line. During an uptrend, the price tends to find support at the average. In a downtrend, it can act as resistance. Traders watch these levels for potential bounce or breakdown entry points.
What is a moving average crossover, and how is it used as a trading signal?
A crossover occurs when a shorter-term average, like a 50-day EMA, crosses above or below a longer-term average, like a 200-day SMA. A cross above is a bullish signal, suggesting upward momentum. A cross below is bearish, indicating a potential downtrend. This is a core component of many trading strategies.
Why is the 200-day moving average considered so important by traders?
The 200-day average is widely watched as a major indicator of the long-term trend. When a cryptocurrency’s price trades above its 200-day average, it is generally considered to be in a bullish market phase. Trading below it often signals a bearish market. It provides critical context for price action.
How do I avoid false signals or ‘whipsaws’ when using these indicators?
Whipsaws are common in choppy, sideways markets. To reduce them, use moving averages with longer periods for a smoother line. Also, confirm signals with other technical analysis tools like volume or the RSI indicator. This helps validate the trend direction and momentum before entering a trade.
Can moving averages be effectively used for short-term crypto trading?
Absolutely. For short-term timeframes, traders often use faster settings, like a 20-period or 50-period Exponential Moving Average. These settings help capture shorter-term trends and momentum shifts on intraday charts, making them suitable for active trading strategies.


No comments yet