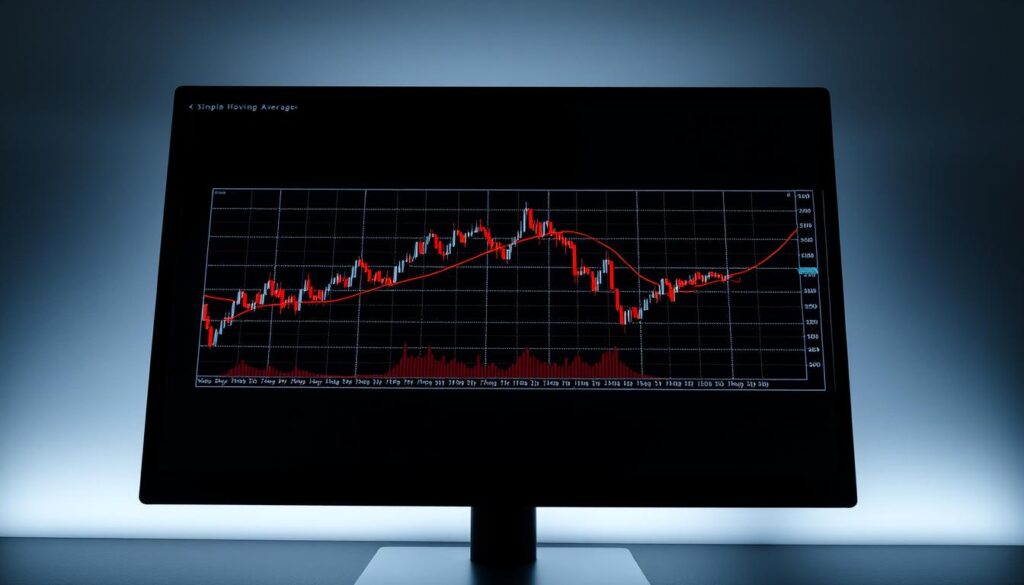
Understanding market trends is critical in volatile crypto markets. One tool stands out for its simplicity and effectiveness: moving averages. These calculations smooth price data over time, helping traders spot patterns amid chaos. They form the backbone of many popular strategies, from day trading to long-term investing.
Professional traders rely on these indicators to filter out market noise. By averaging prices over specific periods, they reveal clearer directional signals. This approach works across all timeframes, whether analyzing minute-by-minute swings or multi-year cycles.
Think of technical analysis like reading ocean waves – moving averages help identify the tide beneath surface ripples. When prices swing wildly, these lines act as stabilizers. They form the foundation for tools like Bollinger Bands and MACD, proving their versatility in modern trading platforms.
Crypto’s rapid price changes make trend identification challenging. Here, moving averages shine by providing objective benchmarks. This guide will explore practical applications, from basic crossovers to advanced strategy combinations. You’ll learn to interpret signals and adapt methods for different market conditions.
Key Takeaways
- Essential trend-following tools for identifying market direction
- Foundation for multiple advanced technical indicators
- Effective across various trading timeframes and styles
- Critical for managing volatility in digital asset markets
- Adaptable to both manual and automated trading systems
Understanding the Basics of Moving Averages
Traders rely on various indicators, but moving averages offer foundational insights. These tools convert chaotic market data into clear visual patterns, acting as filters for price action. Their mathematical nature removes emotional bias – a critical advantage in fast-moving markets.

What Makes These Indicators Essential?
A moving average calculates the average price over chosen time intervals. For example:
| Period Length | Data Points | Market Insight |
|---|---|---|
| 20 periods | Recent price action | Short-term momentum |
| 100 periods | Extended price history | Longer-term direction |
This calculation method creates a flowing line that reduces market noise. It helps spot genuine trends amid random fluctuations. Many platforms automatically plot these lines when analyzing crypto charts.
The Smoothing Effect Explained
Each point on a moving average represents balanced market consensus. By averaging closing prices across multiple candles, extreme swings carry less weight. Shorter periods react faster to price changes, while longer ones provide stable reference points.
These lines also serve as dynamic barriers during price movements. When assets trend upward, the average often acts as support. During declines, it frequently marks resistance levels. This adaptability makes them more useful than fixed price markers.
Exploring Types of Moving Averages in Crypto Trading
Different calculation methods separate effective trend indicators from basic tools. Three core variations help traders balance speed and reliability in fast-paced markets.

Simple Moving Average (SMA) Explained
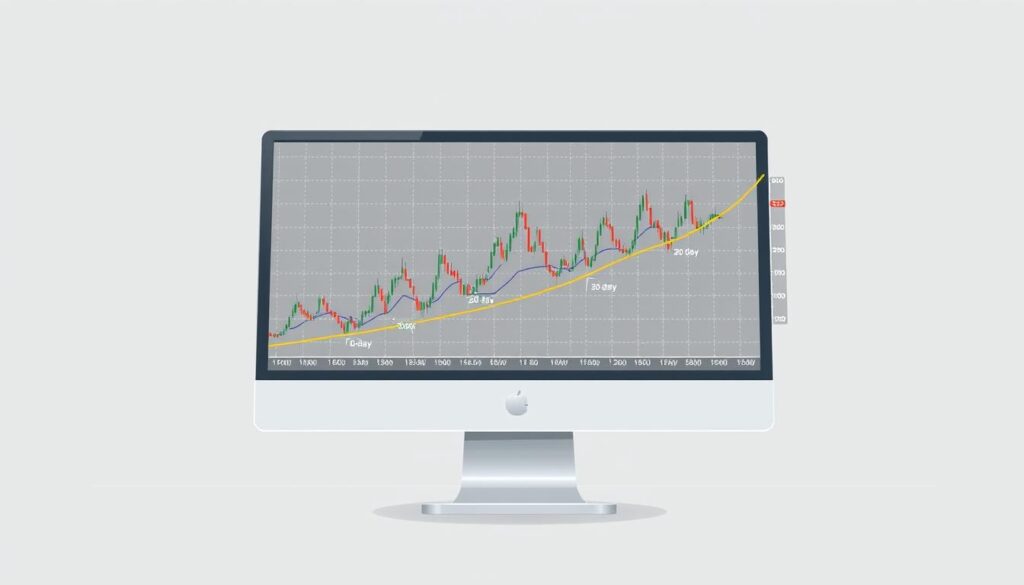
The SMA calculates average prices with equal weight for all periods. A 20-day SMA adds closing prices over 20 days and divides by 20. This creates smooth lines ideal for spotting long-term trends in volatile crypto markets.
Exponential and Weighted Moving Averages (EMA & WMA)
EMA prioritizes recent data using a multiplier formula. For a 3-day EMA: [2 ÷ (3+1)] = 0.5 multiplier. Each new price gets 50% more weight than older ones. WMA uses linear weighting – newer entries matter more, but not exponentially.
| Type | Period Weighting | Responsiveness | Best Use Case |
|---|---|---|---|
| SMA | Equal | Slow | Long-term trend confirmation |
| EMA | Exponential | Fast | Short-term entry signals |
| WMA | Linear | Moderate | Medium-term swing trading |
Day traders often combine EMA with SMA for crossover strategies. Longer SMAs (100-200 periods) work well for identifying support zones. Remember: faster averages react quickly but generate more false signals.
Choosing between these tools depends on your risk tolerance and time horizon. Explore how moving averages work in live market scenarios to refine your approach.
How to use moving averages for cryptocurrency trading technical analysis
Chart configuration forms the backbone of effective analysis. Selecting appropriate timeframes and periods transforms raw price data into actionable insights. Longer intervals filter out market noise, while shorter ones capture immediate momentum shifts.

Setting Up Your Chart and Adjusting Periods
Timeframe selection directly impacts signal reliability. Daily charts reduce false alerts compared to minute-based views. Consider this hierarchy when establishing your baseline:
| Timeframe | Signal Strength | Suggested MA Periods |
|---|---|---|
| 1-15 Minute | High Noise | 3-10 SMA/EMA |
| 4-12 Hour | Moderate | 20-50 WMA |
| Daily-Weekly | Strong | 100-200 SMA |
Day traders often use 5-minute charts with 9-period EMAs for quick entries. Position traders combine 50-day and 200-day SMAs to spot macro trends. Most platforms let you add these indicators through built-in technical analysis menus.
Interpreting Signal and Trend Strength
Price position relative to the MA reveals market sentiment. Sustained movement above a 100-period SMA suggests bullish dominance. Multiple touches without breakdowns confirm strong support levels.
Compare short and long-term averages for confirmation. When the 20-period crosses above the 50-period, it signals growing buying pressure. Volume spikes during these crossovers add credibility to the trend shift.
| Signal Type | Strength Indicator | Actionable Insight |
|---|---|---|
| Price > 200 SMA | Bullish Trend | Consider long positions |
| Double MA Crossover | Momentum Shift | Prepare entry/exit |
| Flatlined MA | Market Indecision | Reduce position size |
Developing a Moving Average Trading Strategy
Building a profitable approach involves decoding critical chart interactions. Crossovers between different period averages act as market turning points, revealing shifts in trader sentiment. These moments often precede major price movements when confirmed with supporting evidence.

Identifying Trends and Crossovers
The Golden Cross pattern emerges when a 50-period average climbs above the 200-period line. This bullish signal frequently marks the start of extended upward trends. Conversely, the Death Cross occurs when shorter averages drop below longer ones, often signaling bear markets.
| Signal Type | Formation | Typical Outcome |
|---|---|---|
| Golden Cross | 50 MA > 200 MA | Bullish momentum |
| Death Cross | 50 MA | Bearish reversal |
Crossovers gain strength when accompanied by rising trading volume. Multiple averages converging in one direction create high-confidence signals. For example, 20/50/100-period alignment often confirms sustained trends.
Combining Multiple Indicators for Robust Signals
Pair moving averages with momentum oscillators for verification. RSI readings above 70 during a Death Cross may indicate false breakdowns. MACD histogram alignment with crossover direction adds confirmation layers.
| Confirmation Tool | Purpose | Ideal Scenario |
|---|---|---|
| RSI | Validate overbought/oversold conditions | RSI |
| Volume | Confirm participation in trend shifts | Spike above 50-day average |
| MACD | Detect momentum alignment | Histogram crosses zero line |
Three-average systems reduce false signals by requiring multiple confirmations. A 10-period crossing 50-period, followed by 50-period exceeding 200-period, creates phased entry opportunities. Always assess market context – trending phases yield better results than choppy markets.
Optimizing Moving Average Settings for Different Timeframes
Tailoring indicator parameters to specific goals separates casual observers from strategic traders. Effective configuration balances responsiveness with reliability, adapting to individual risk profiles and market phases.
Selecting Periods for Short-Term Versus Long-Term Trades
Active traders monitoring 15-minute charts often employ 5-15 period EMAs. These settings capture rapid momentum shifts while filtering minor fluctuations. Position traders analyzing weekly trends typically combine 50 and 200-period SMAs to identify macroeconomic patterns.
| Timeframe | Suggested MA Type | Period Range | Use Case |
|---|---|---|---|
| Scalping (Minutes-Hours) | EMA | 5-15 | Catching intraday breakouts |
| Swing Trading (Days) | WMA | 20-50 | Riding multi-day trends |
| Position Trading (Weeks+) | SMA | 100-200 | Identifying macro cycles |
Highly volatile assets like meme coins often require longer periods. A 30-period WMA might smooth erratic price action better than standard settings. Stablecoins paired with BTC could use shorter spans for precise entries.
Backtesting reveals optimal combinations for specific assets. Compare historical performance across different settings before live deployment. Paper trading helps verify effectiveness without capital risk.
Market conditions dictate adjustments. Trending phases favor shorter averages for early signals. Choppy markets benefit from extended periods that ignore false breakouts. Successful traders review settings quarterly, adapting to evolving volatility patterns.
Leveraging the Good Crypto App to Trade with Moving Averages
Modern trading platforms transform theoretical strategies into executable actions. The Good Crypto app streamlines decision-making by combining multiple indicators with automated execution tools. Its cross-exchange functionality lets traders act on signals faster than manual methods allow.
Automated Alerts and Strategic Execution
The platform scans 15 distinct moving averages alongside 10 momentum oscillators. This multi-indicator approach identifies high-probability entry and exit zones. When a 50-period SMA crosses above a 200-period line, the system triggers alerts across connected exchanges.
Programmable orders turn signals into risk-managed positions instantly. Users set conditions like: “Buy BTC at $40,000 → Auto-place stop at $38,000 → Take profit at $50,000.” This eliminates emotional delays during volatile swings.
Price levels derived from moving averages become dynamic support and resistance markers. The app tracks these zones in real-time, adjusting orders as trends evolve. Traders maintain positions until key averages break – locking in gains while limiting downside exposure.
By automating repetitive tasks, the tool lets traders focus on strategy refinement. Backtested settings produce consistent results across 30+ exchanges. In fast-moving markets, this blend of speed and precision creates measurable advantages.


No comments yet