
Navigating digital asset markets requires sharp analytical skills and disciplined execution. Traders capitalize on intraday price movements by identifying recurring patterns and psychological thresholds where supply and demand collide. These critical zones often dictate short-term momentum shifts across Bitcoin, Ethereum, and altcoins.
Unlike traditional markets with fixed hours, decentralized exchanges never sleep. This constant activity creates unique challenges for those analyzing price charts. Effective strategies combine historical data interpretation with real-time sentiment tracking to anticipate potential breakout or reversal points.
Two concepts form the backbone of technical analysis in volatile conditions. Historical accumulation zones tend to prevent further declines, while established distribution areas often cap upward movements. Recognizing these boundaries helps traders manage risk exposure during rapid market fluctuations.
Key Takeaways
- Price boundaries reveal crowd psychology through repeated market reactions
- 24/7 market operation demands adaptive risk management strategies
- Historical patterns gain significance in speculative environments
- Combining multiple indicators increases prediction accuracy
- Real-world application differs from theoretical models in live markets
This guide explores practical methods for mapping critical price thresholds across different timeframes. You’ll discover how seasoned traders combine these concepts with volume analysis and market structure evaluation to build robust decision-making frameworks.
Introduction to Crypto Day Trading and Technical Analysis
Round-the-clock price action defines digital asset exchanges, creating unique opportunities for active participants. Unlike traditional markets with fixed sessions, crypto platforms operate 24/7, demanding constant vigilance from market participants. This nonstop environment amplifies both profit potential and risk exposure.
Decoding Market Dynamics
Volatility drives crypto markets, with assets like Bitcoin frequently swinging 5-10% within hours. Successful participants balance rapid execution with strict risk parameters. Scalping strategies prove popular, capturing incremental gains through numerous small trades.
Chart Literacy Essentials
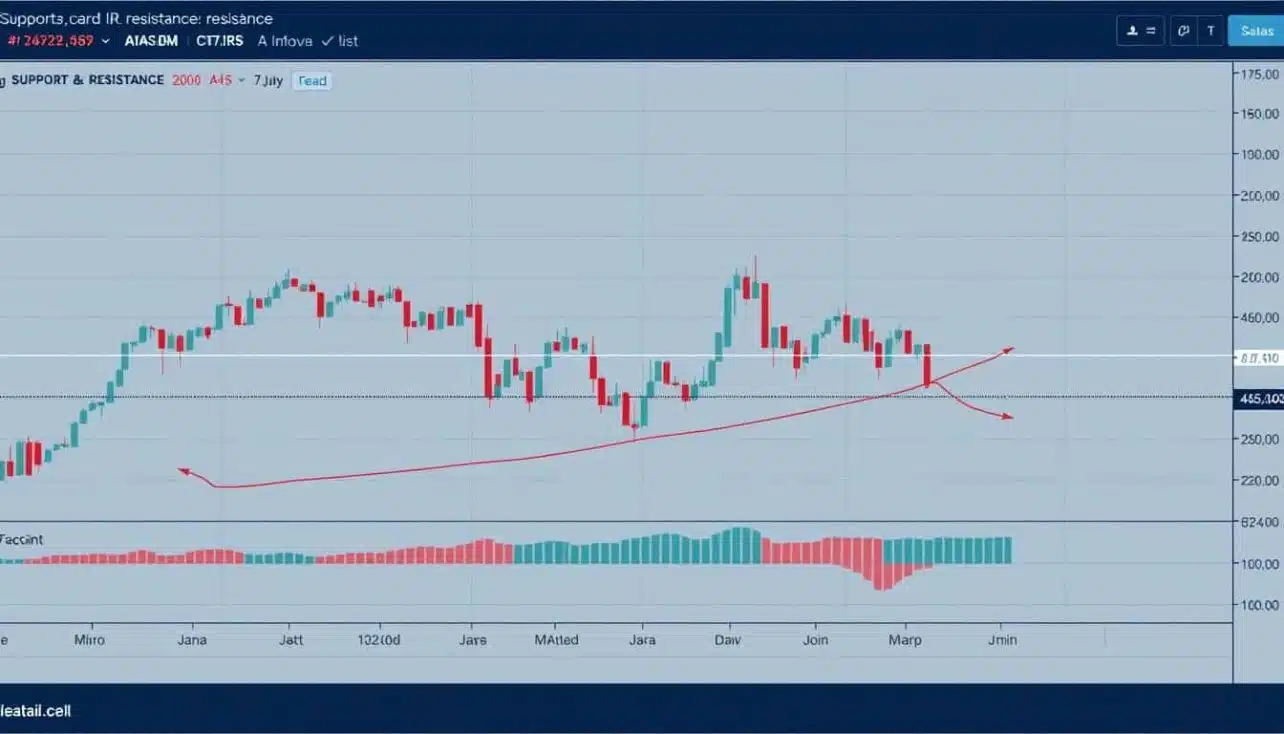
Price charts become decision-making roadmaps in speculative environments. Candlestick formations reveal crowd psychology, while trendlines map recurring price boundaries. These visual tools transform raw data into actionable intelligence when combined with volume metrics.
Emotional discipline separates consistent performers from impulsive gamblers. Objective chart evaluation overrides gut reactions, creating structured entry and exit protocols. Modern traders supplement traditional patterns with algorithmic alerts for real-time advantage.
Understanding Support and Resistance Levels
Market participants constantly seek predictable patterns within chaotic price movements. These patterns emerge through collective trader behavior, forming invisible barriers that shape market trajectories.

Defining Trading Boundaries
A support line acts as a safety net where downward momentum typically stalls. Buyers become active here, believing assets are undervalued. Conversely, resistance zones mark ceilings where selling pressure intensifies as traders secure profits.
These thresholds gain validity through repetition. When prices bounce off the same area multiple times, participants recognize it as significant. Five failed attempts to break $50,000 Bitcoin carry more weight than two rejections at $49,500.
Market Psychology in Action
Round numbers often become battlegrounds. Institutional orders cluster at clean figures like Ethereum’s $4,000 mark. Retail traders reinforce these zones through collective stop-loss placements and profit targets.
Dynamic shifts occur as new data emerges. A breached resistance often becomes future support. Successful traders monitor these transitions through volume spikes and candlestick patterns rather than relying solely on historical data.
How to use support and resistance levels for cryptocurrency day trading
Successful intraday execution hinges on precise entries near critical zones where market momentum shifts. Traders identify accumulation areas where buyers consistently emerge, paired with distribution regions where sellers dominate. These zones gain strength through repeated price reactions, creating reliable decision points.

In bullish conditions, enter positions after consolidation near historical demand areas. Wait for price to break above the congestion range’s high before committing capital. For bearish setups, observe rejection patterns at established supply zones before initiating short positions.
Protective stops belong slightly beyond tested boundaries – typically 1-2% below confirmed demand areas for long trades. This buffer accounts for volatility while maintaining favorable risk-reward ratios. Combine these thresholds with moving averages or volume spikes for higher-probability setups.
Bitcoin’s recent bounce from $56,500 demonstrates this approach. After three successful tests of this zone, buyers pushed price upward with above-average trading activity. Ethereum’s repeated failures to hold $3,200 created profitable shorting opportunities until substantial buying volume emerged.
New traders often misjudge zone validity by acting on untested levels. Always verify boundaries through multiple touchpoints across different timeframes. Pair these techniques with position sizing rules to preserve capital during false breakouts.
Setting Up Your Trading Charts and Tools
Customizing trading platforms transforms raw market data into actionable insights. Effective layouts prioritize clean visuals while maintaining access to critical metrics. Three elements dominate professional setups: price action clarity, indicator synergy, and quick-execution readiness.

Optimizing Chart Layouts and Indicators
Timeframe selection determines strategy effectiveness. Scalpers favor 5-minute charts, while swing traders analyze 4-hour views. Overlaying candlestick patterns with volume bars creates multi-dimensional analysis perspectives without clutter.
Color contrast matters. Use warm hues for rising prices and cool tones for declines. This visual coding speeds pattern recognition during volatile sessions. Limit indicators to three complementary tools – excessive overlays create confusion.
Leveraging Moving Averages and Trendlines
Moving averages act as dynamic guides. The 25-day SMA smooths noise for trend confirmation, while the 50-day EMA reacts faster to sudden shifts. Crossovers between these lines often precede momentum changes.
| Type | Timeframe | Primary Use |
|---|---|---|
| SMA | 200-day | Long-term trend identification |
| EMA | 25-day | Short-term entry signals |
| EMA | 50-week | Institutional reference points |
Trendlines gain validity through multiple touches. Connect at least three swing highs/lows using logarithmic scales for crypto’s exponential moves. These lines frequently align with day trading strategies when combined with volume confirmation.
Always test configurations in demo accounts before live deployment. Successful traders refine setups continuously as market conditions evolve.
Identifying Key Support and Resistance Zones
Chart patterns reveal hidden market truths through repeated crowd behavior. Traders pinpoint recurring boundaries where assets reverse direction, creating actionable zones for strategic entries. These thresholds emerge when prices stall at similar values across weeks or months.

Using Historical Price Data to Spot Levels
Valid thresholds require multiple confirmations. Two distinct price rejections mark the minimum standard for zone identification. Three or more reactions significantly increase a level’s reliability.
Recent activity outweighs older data. A boundary tested last week holds more weight than one from six months prior. Current market conditions often override historical patterns during extreme volatility.
| Factor | Validation Criteria | Importance |
|---|---|---|
| Rejection Count | Minimum 2 confirmed reactions | Filters false signals |
| Time Relevance | Last 30-60 days preferred | Reflects current sentiment |
| Price Range | 1.5-3% zone width | Accounts for volatility |
Horizontal lines on charts transform abstract numbers into visual battle zones. Draw these where prices repeatedly pause or reverse. Wider bands work better than precise lines in fast-moving markets.
Volume spikes validate zone strength. Heavy trading activity during rejections confirms genuine buyer/seller interest. Combine this with swing trading strategies for multi-timeframe confirmation.
False breakouts test patience. Wait for closing prices beyond zones before acting. This approach avoids traps set by temporary spikes through low-liquidity periods.
Trading Strategies Around Support and Resistance
Strategic execution separates profitable traders from market participants. Three approaches dominate short-term trading: range-bound tactics, momentum plays, and precision scalping. Each method requires distinct entry protocols and exit criteria aligned with market phases.
Applying Swing Trading and Scalping Techniques
Range traders thrive in sideways markets. They buy near historical demand zones and sell at established supply areas. This approach works best when prices bounce between clear boundaries for multiple sessions.
Breakout specialists wait for decisive price breaches. A close above resistance with high volume signals potential trend acceleration. Conversely, breakdowns below support often precede sharp declines.
| Strategy | Market Condition | Key Signal |
|---|---|---|
| Range Trading | Consolidation | Price rejection at boundaries |
| Breakout | Volatility expansion | Closing price beyond zone |
| Scalping | All conditions | Short-term reversals |
Implementing Effective Risk Management
Stop-loss orders belong beyond recent swing points. This placement avoids market noise while protecting capital. Never risk more than 2% of your account on any trade.
Take-profit targets should align with adjacent price zones. Scaling out positions locks gains while allowing partial exposure to extended moves. Emotional discipline ensures adherence to pre-defined plans during volatility spikes.
Integrating Technical Indicators for Enhanced Analysis
Sophisticated chart analysis combines multiple data streams to validate trading hypotheses. Three metrics frequently complement price boundary strategies: momentum oscillators, trend confirmers, and activity gauges. These tools filter noise while highlighting high-probability setups near critical thresholds.
Utilizing RSI, MACD, and Volume Metrics
The Relative Strength Index (RSI) measures price change velocity. Values above 70 suggest overbought conditions near resistance areas. Readings below 30 indicate potential reversals at demand zones. Divergences between price and RSI often precede trend shifts.
Moving Average Convergence Divergence (MACD) confirms momentum changes. Bullish crossovers occur when the MACD line pierces its signal line upward. These signals gain credibility near historical accumulation areas. Bearish crosses below the signal line warn of weakening momentum at supply zones.
| Indicator | Primary Function | Key Signal |
|---|---|---|
| RSI | Momentum measurement | Overbought/oversold extremes |
| MACD | Trend confirmation | Line crossovers |
| Volume | Activity validation | Spikes at key levels |
Trading activity metrics separate meaningful breaks from false moves. Surges above average volume confirm genuine interest when prices test boundaries. Low participation during breakouts often leads to reversals.
Bitcoin’s recent rejection at $63,000 demonstrates this synergy. RSI showed divergence while MACD flattened – both warning signs. The breakdown occurred alongside declining volume, confirming weak bullish conviction.
Effective strategies use 2-3 complementary tools. Pair momentum oscillators with volume analysis for multi-factor confirmation. Avoid cluttering charts with redundant metrics that cloud decision-making.
Incorporating Advanced Tools and Smart Money Signals
Traders enhance their edge by blending classic patterns with institutional-grade analytics. Market liquidity pools and order flow data now complement traditional chart analysis, revealing where large players position themselves.
Exploring Supertrend and Volatility Tools
The Supertrend indicator adapts to market swings, flashing green during uptrends and red in downtrends. Its dynamic calculations outperform static lines in fast-moving crypto markets. Combine it with ATR (Average True Range) to gauge breakout potential.
Pivot Points offer mathematical precision. These pre-calculated zones predict potential reversal areas using prior day’s high/low/close. Major coins like Bitcoin often respect monthly pivot levels during liquid trading sessions.
Building Custom Trading Frameworks
Seasoned participants develop proprietary tools tracking whale wallets and exchange reserves. These custom indicators flag unusual activity before price moves. Pair them with volume profile analysis to confirm institutional participation at key thresholds.
Effective strategies evolve through backtesting. Refine parameters using historical data, then validate in live markets. Remember: No tool guarantees success, but layered signals improve decision-making in unpredictable conditions.
No comments yet