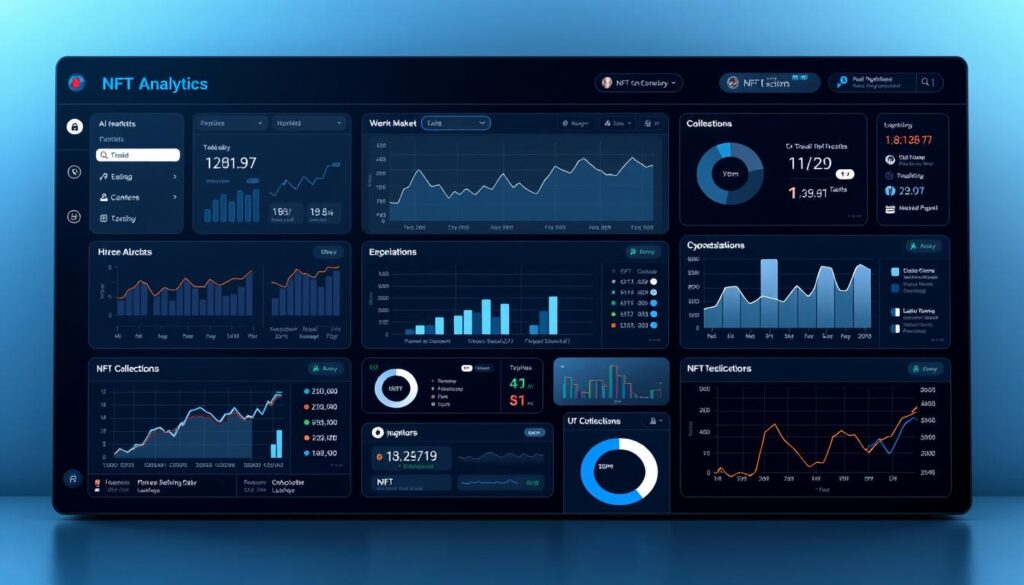
The digital collectibles space has transformed dramatically, driven by advanced platforms that empower investors with real-time insights. What began as simple tracking systems now offer predictive analytics, historical trends, and risk evaluation features. These innovations help users navigate volatility while identifying high-potential opportunities.
Recent projections reveal explosive growth for this sector. By 2035, specialized analytical technology could surpass $740 million in value, expanding at nearly 14% annually. Meanwhile, the broader ecosystem is expected to grow thirtyfold by 2032, exceeding half a trillion dollars. Web-based solutions dominate this landscape, capturing two-thirds of user preference due to their accessibility.
Modern tools integrate blockchain protocols and machine learning to deliver accurate forecasts. They process vast datasets—from transaction histories to social sentiment—helping investors make informed decisions. As competition intensifies, these platforms evolve rapidly, offering features like portfolio simulations and customizable alerts.
Key Takeaways
- Specialized analytics platforms are projected to grow 13.7% yearly, reaching $742 million by 2035
- Web-based tools currently dominate the sector with 67% market share
- Real-time data processing and blockchain integration enhance prediction accuracy
- The broader digital collectibles ecosystem could exceed $520 billion by 2032
- Investors increasingly rely on data-driven strategies to manage risk and returns
Understanding NFT Market Analysis and Price Prediction Tools
Navigating the dynamic realm of digital collectibles requires precise tools that decode complex trends. These solutions aggregate information across blockchain networks and trading platforms, offering unified insights into collection valuations and activity patterns. Real-time tracking features let users monitor sales momentum, while historical charts reveal long-term performance shifts.

Leading platforms like Dune Analytics and Nansen excel at identifying emerging projects across multi-chain ecosystems. They filter through thousands of transactions to spotlight undervalued assets or trending collections. Customizable dashboards highlight metrics like ownership history and rarity scores, helping users assess potential value shifts.
Sophisticated systems process social sentiment alongside on-chain activity. This dual approach improves prediction accuracy by correlating community engagement with trading behaviors. Investors leverage these insights to time acquisitions or diversify portfolios strategically.
Free mint alerts and project launch calendars give early access to opportunities. Advanced filters sort assets by traits, creators, or liquidity levels. Such granular data empowers informed decisions in fast-moving environments where timing dictates returns.
The Evolution of Non-Fungible Tokens and Blockchain Technology
From pixelated cats to million-dollar art, blockchain-based assets reshaped digital ownership. Early experiments like CryptoKitties (2017) proved unique tokens could hold real value. By 2021, this concept exploded when Beeple’s “Everydays: The First 5000 Days” sold for $69 million, cementing non-fungible tokens as cultural phenomena.

A Brief History of NFTs
The non-fungible token sector grew from niche tech circles to mainstream adoption in three phases:
- 2017-2018: CryptoKitties demonstrated blockchain’s capacity for digital collectibles
- 2019-2020: Artists began tokenizing work, with art sales jumping from 28,400 to 109,100 units in four months
- 2021-Present: Major brands and entertainment platforms adopted tokens for fan engagement
The Role of Blockchain in NFT Validation
Blockchain technology solves a critical digital problem: proving authenticity. Each token uses smart contracts to record:
- Creation timestamps
- Ownership transfers
- Metadata integrity
This system prevents duplication while enabling transparent provenance tracking. Unlike traditional certificates, blockchain entries can’t be altered – a feature driving trust in digital asset markets.
Market Trends Shaping the NFT Landscape
The surge in digital asset participation reveals explosive shifts in collector behavior. In 2021, crypto wallets holding or exchanging unique tokens skyrocketed from 89,000 to 2.5 million. Buyers multiplied thirtyfold, reaching 2.3 million active participants globally.

Sales Growth and Volume Dynamics
Profit patterns highlight the sector’s potential. Investors gained $5.4 billion from token sales, with 470 wallets clearing $1 million+ returns. Collectibles dominated at $8.4 billion in transactions, while gaming-related assets secured $5.2 billion. These figures reflect evolving consumer priorities in blockchain-based ownership.
Adoption Trends Across Regions
Geographical preferences shape trading behaviors. North American collectors prioritize art and virtual real estate, while Asian markets drive gaming token demand. Emerging economies show increased interest in utility-focused digital assets, particularly for identity verification and event access.
Platforms now track regional momentum shifts through localized metrics. This data helps identify underserved niches, from Middle Eastern sports memorabilia to South American music royalties. As global participation expands, predictive tools adapt to forecast sector-specific growth patterns.
Economic Impacts on Digital Assets and Investment Portfolios
Modern wealth strategies now integrate blockchain-based holdings alongside traditional stocks and bonds. This shift reflects growing confidence in digital assets as viable portfolio components. DeFi platforms like Arcade demonstrate this trend, allowing collectors to secure loans using tokenized collateral while funds remain in escrow.

Investor Behavior and Market Valuations
Portfolio managers face unique challenges when appraising blockchain-linked holdings. Unlike conventional securities, digital assets derive value from community engagement and cultural relevance. Specialized metrics track Discord activity, creator reputations, and utility potential to gauge long-term viability.
Three key factors differentiate digital asset valuation:
| Factor | Traditional Assets | Digital Assets |
|---|---|---|
| Primary Value Drivers | Cash flow, dividends | Community sentiment, utility |
| Liquidity Profile | Predictable markets | 24/7 global trading |
| Ownership Verification | Centralized registries | Blockchain validation |
Investors balance these dynamics through strategic allocations. Fractional ownership models let participants enter high-value markets with smaller commitments. However, Ethereum’s ERC-20 and ERC-721 standards often impose substantial transaction costs, impacting overall returns.
Behavioral patterns reveal generational divides. Younger demographics prioritize digital ownership experiences, while institutions focus on portfolio diversification. Social media trends frequently dictate short-term price movements, requiring real-time monitoring tools for informed decisions.
NFT Pricing Dynamics and Transaction Analysis
Understanding valuation mechanisms requires dissecting the interplay between creator inputs and secondary market forces. Initial mint prices often reflect artistic merit or utility promises, but secondary trading introduces complex variables. Platforms like NFT Price Floor aggregate information across exchanges, tracking metrics like floor values and collection rankings through real-time data streams.
Historical Patterns in Asset Valuation
Past performance metrics reveal recurring cycles in digital collectibles. Seasonal demand spikes around cultural events often boost specific categories, while bear markets correlate with reduced trading velocity. Three key factors emerge from historical analysis:
| Factor | Appreciation Driver | Depreciation Risk |
|---|---|---|
| Community Growth | +37% value impact | -22% if stagnant |
| Utility Expansion | +29% average lift | -15% without updates |
| Creator Activity | +41% premium | -33% if inactive |
Instantaneous Market Tracking Systems
Modern platforms employ algorithmic models that process blockchain events within milliseconds. These systems cross-reference:
- Pending transactions across 14+ chains
- Liquidity pool fluctuations
- Social media sentiment shifts
Such granular tracking helps investors spot emerging opportunities before major price movements. However, data latency remains a challenge – transactions on slower networks sometimes create temporary valuation gaps between platforms.
Key Features and Benefits of NFT Analytics Platforms
In the fast-paced world of digital assets, robust analytics solutions bridge the gap between raw blockchain records and actionable strategies. These systems transform chaotic transactional information into organized visual narratives, empowering users to spot trends and anomalies effortlessly.
User Interface and Data Visualization
Leading platforms prioritize clarity through interactive dashboards that adapt to user preferences. Customizable widgets display metrics like collection rarity scores, ownership distribution, and cross-marketplace liquidity. Three elements define modern interfaces:
- Drag-and-drop layouts for personalized metric tracking
- Color-coded heatmaps showing real-time trading activity
- Historical comparison tools with adjustable timeframes
Such features enable both beginners and experts to correlate social media trends with asset performance quickly. Mobile-optimized designs ensure critical updates remain accessible during market fluctuations.
Accuracy and Timeliness of Market Data
High-frequency trading environments demand millisecond-level synchronization across 20+ blockchain networks. Advanced platforms employ:
- Decentralized node networks for real-time verification
- Machine learning models that flag inconsistent records
- Automated reconciliation of marketplace discrepancies
These technical safeguards maintain data integrity while processing 50,000+ transactions hourly. Users receive alerts for significant portfolio changes or emerging collection trends, enabling informed decisions before opportunities vanish.
Regional Insights and Segmentation in NFT Trading
Geographical differences create distinct patterns in how collectors engage with blockchain-based assets. While some areas focus on high-value art, others prioritize utility-driven tokens. These variations shape platform development and feature priorities across global markets.
North America’s Strategic Advantage
The United States dominates with 24.6% of global activity, housing 41.5% of specialized startups. Early adoption of blockchain infrastructure gives the region an edge in analytics innovation. Three factors maintain this leadership:
- Concentration of venture capital in tech hubs
- Established regulatory frameworks for digital ownership
- High consumer trust in decentralized platforms
Asia Pacific’s Accelerated Expansion
South Asia Pacific grows at 18% annually – the fastest rate worldwide. Thailand commands 15% of East Asian transactions, while India sees 300% user base increases through mobile-first strategies. Key growth drivers include:
| Country | Specialization | Growth Catalyst |
|---|---|---|
| Thailand | Gaming assets | Government blockchain initiatives |
| India | Affordable collectibles | Mobile payment integration |
| Philippines | Virtual real estate | Remittance tokenization |
Regional compliance requirements vary significantly. European platforms prioritize privacy features, while Asian services focus on cross-border transaction tools. These adaptations help companies address specific market demands while navigating local regulations.
Leveraging Mobile and Web-Based NFT Tools for Portfolio Management
Modern investors balance fast-paced opportunities with strategic planning through specialized tools. Two distinct approaches dominate: mobile-first convenience and web-powered depth. Choosing the right platform depends on investment goals, technical needs, and lifestyle demands.
Innovations in Mobile Analytics
Smartphone apps bring critical metrics to users’ fingertips. Push notifications alert collectors about portfolio changes or new asset launches within seconds. Simplified dashboards display real-time floor prices and collection rankings, ideal for quick checks during meetings or commutes.
Offline synchronization ensures access to historical trends without internet connectivity. This feature proves vital when traveling or in areas with spotty service. Mobile-first platforms prioritize speed, letting users execute trades directly from alert notifications.
Advantages of Web-Based Platforms
Desktop solutions handle complex management tasks that mobile screens can’t display effectively. Multi-window setups allow simultaneous tracking of multiple collections. Advanced charting tools reveal hidden patterns across years of transaction data.
Cross-platform integration creates seamless workflows. Users might monitor positions via mobile during the day, then analyze trends on desktop at night. This synergy helps investors act swiftly while maintaining strategic oversight.
Professionals often combine both platforms for optimal results. Mobile apps capture time-sensitive opportunities, while web tools manage long-term strategy. As adoption grows, developers continue bridging gaps between device-specific features.
Competitive Landscape in the NFT Analytics Tools Industry
The race to dominate blockchain analytics has sparked intense competition among tech innovators. Established platforms now face pressure from agile startups offering niche solutions. This rivalry drives rapid feature upgrades and strategic alliances across the sector.
Major Industry Players and Market Shares
Nansen and Dune Analytics control over 40% of the specialized analytics space. Smaller rivals like Etherscan and Lucky Trader gain traction through hyper-focused offerings. Three factors shape market positioning:
Data depth separates leaders from challengers. Top platforms track 90%+ of Ethereum transactions, while newcomers struggle with cross-chain coverage. User experience also plays a critical role, with intuitive interfaces driving 68% of customer retention.
Recent Mergers, Acquisitions, and Partnerships
Consolidation reshapes the field as larger firms acquire complementary technologies. Nansen’s 2023 purchase of Ape Board expanded its multi-chain monitoring capabilities. Dune Analytics partnered with Coinbase to integrate real-time exchange data, enhancing predictive models.
Startups increasingly collaborate with blockchain networks. These alliances provide early access to protocol upgrades, creating competitive advantages. As innovation accelerates, only platforms offering unique value propositions will thrive long-term.


No comments yet