The digital economy has undergone a seismic shift with the rise of blockchain-based assets. Once considered niche collectibles, these unique digital items now represent a $30 billion market projected to surpass $210 billion by 2033. Platforms like OpenSea see over 250,000 monthly traders, while quarterly transaction volumes regularly exceed $3.5 billion across major exchanges.
Traditional appraisal methods struggle with non-fungible tokens due to their inherent uniqueness and rapidly changing market dynamics. Each asset carries distinct cultural, historical, and technical attributes that defy conventional analysis. This complexity creates opportunities for effective monetization strategies requiring specialized evaluation frameworks.
Three critical factors drive valuation challenges:
- Scarcity models tied to blockchain verification
- Community-driven perception of worth
- Real-time market sentiment fluctuations
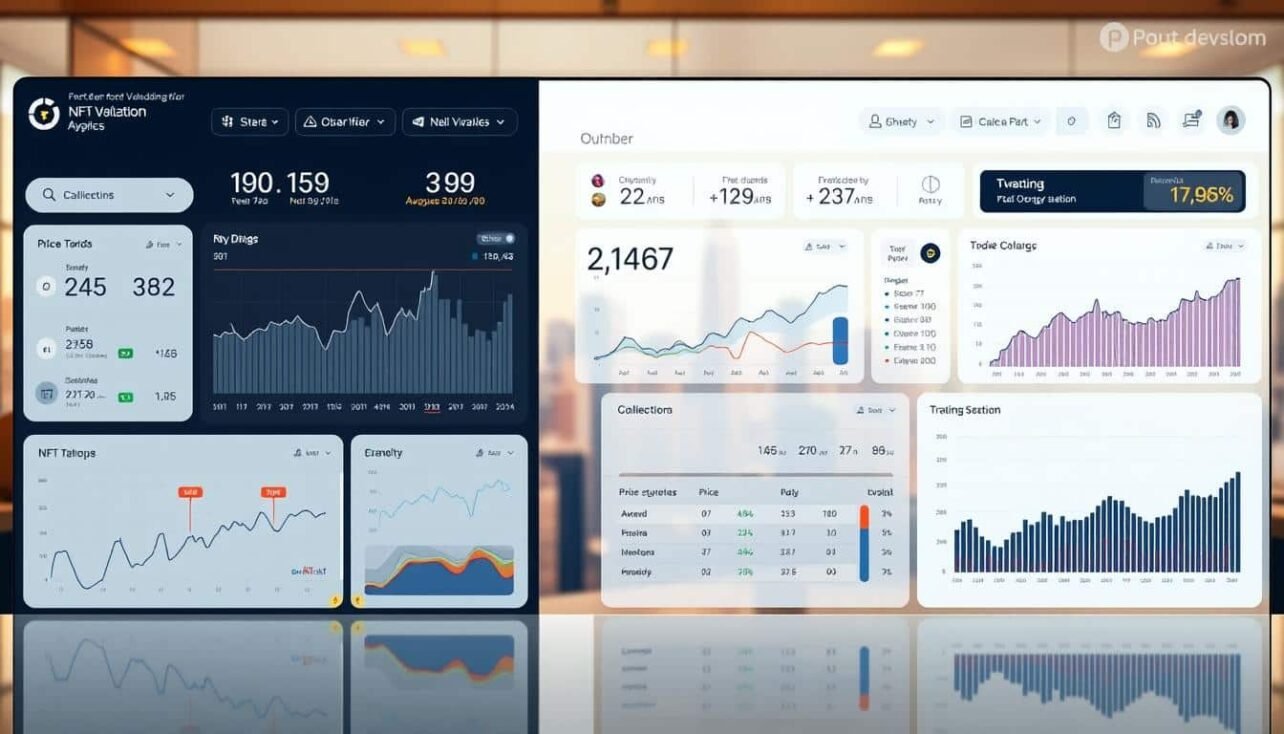
Collectors, investors, and creators increasingly rely on data-driven tools to navigate this landscape. Advanced analytics now track over 50 metrics across sales history, creator reputation, and social engagement. These solutions empower stakeholders to make informed decisions in a market growing at 24% annually.
Key Takeaways
- Global market value expected to grow 7x by 2033
- Over 250,000 monthly active traders on leading platforms
- Traditional valuation methods fail for blockchain assets
- Specialized tools analyze 50+ unique metrics
- Real-time data crucial for accurate assessments
- Multiple stakeholder groups require tailored solutions
Understanding the NFT Market and Its Valuation Challenges
Blockchain innovation has redefined ownership concepts through cryptographic tokens. These digital assets carry unique identifiers stored permanently on decentralized ledgers. Unlike traditional collectibles, each token’s metadata confirms authenticity through immutable verification processes.
NFT Fundamentals and Digital Ownership
Digital ownership relies on blockchain’s ability to track provenance. Each token acts as a certificate for specific content, whether art files or virtual land deeds. This system prevents duplication while enabling transparent transfer records.
Three characteristics define these assets:
- Non-interchangeable cryptographic signatures
- Smart contract-based ownership transfers
- Decentralized storage of transaction history
Impact of Market Volatility on Valuation
Crypto market swings directly influence token values. A 30% Bitcoin drop in May 2023 triggered 41% declines across major collections. Social media trends amplify fluctuations – celebrity endorsements sometimes double prices within hours.
Platforms track real-time data streams to identify patterns. Metrics like trading volume shifts and wallet activity help assess risk. However, sudden regulatory changes or platform outages can still disrupt valuations unexpectedly.
Key Components in NFT Valuation and Prediction
Digital collectibles derive worth from multiple interconnected factors. Four elements shape market perception: functional benefits, scarcity metrics, creator influence, and transaction patterns. Analysts weigh these components differently based on asset type and market conditions.
Evaluating Utility and Rarity
Functional benefits extend beyond basic ownership rights. Tokens granting event access or community privileges often trade 63% higher than static counterparts. Rarity assessment involves:
- Trait combination analysis across collections
- Blockchain-verified edition numbers
- Algorithmic scarcity scoring models
Art collections use rarity rankings to identify premium pieces. A Bored Ape with 0.03% trait frequency recently sold for 19x the floor value.
The Role of Creator Reputation and Historical Sales Data
Established artists command 82% higher prices than newcomers. Beeple’s works maintain value despite market dips, demonstrating brand power. Historical transaction patterns offer critical benchmarks:
- 30-day average sale prices
- Ownership change frequency
- Bid-ask spread dynamics
Platforms like Art Blocks display real-time sales data across 12+ metrics. However, rapid innovation requires adjusting historical comparisons – 2021 pricing models now show 47% accuracy gaps.
NFT price prediction and valuation tools
Advanced data solutions now power modern collectible valuation strategies. Leading marketplaces such as OpenSea and Rarible offer transparent transaction histories, revealing patterns in buyer activity. These hubs track over 12 million monthly trades, providing raw metrics for informed decisions.

Specialized analytics platforms transform raw numbers into actionable insights. Dune Analytics processes blockchain records to map wallet interactions, while Nansen flags emerging trends through real-time dashboards. CryptoSlam aggregates sales data across 50+ chains, identifying undervalued assets.
Three steps to access critical information:
- Filter marketplace listings by traits and historical performance
- Cross-reference on-chain activity via Glassnode’s liquidity charts
- Set custom alerts for specific creators or collections
For those exploring investment platforms, combining these datasets reveals hidden opportunities. Free tools like Mintable’s trend tracker help newcomers navigate complex metrics. Premium services offer predictive modeling – CryptoQuant’s algorithms forecast demand shifts with 79% accuracy.
Effective analysis requires blending multiple data streams. Market veterans often layer social sentiment tracking with ownership history. This approach accounts for both technical fundamentals and cultural relevance in fast-moving digital markets.
Methodologies for Valuing NFTs
Experts use four core methods to determine fair market value for blockchain-based collectibles. Each approach suits different asset types and market conditions. Combining techniques often yields the most reliable estimates.

Comparative Sales and Market Approach
This method analyzes recent transactions of similar items. A CryptoPunk with rare traits might reference three comparable sales: $1,800, $2,000, and $1,950. The average $1,917 becomes the baseline value.
Key considerations include:
- Transaction dates (within 30 days ideal)
- Trait similarity scores
- Platform fee adjustments
Discounted Cash Flow and Cost-based Techniques
Utility-focused assets benefit from income analysis. A membership token generating $50 monthly would calculate present value at 10% discount rate:
| Approach | Use Case | Strength | Limitation |
|---|---|---|---|
| Market | Common collectibles | Real-time data | Requires comps |
| Income | Revenue-generating | Future potential | Assumption risk |
| Cost | New creations | Production baseline | Ignores demand |
| Rarity | Trait-based | Scarcity focus | Subjective weights |
The cost approach tallies creation expenses. An artist spending $400 on design, $50 minting, and $10 listing would set a $460 floor value. This method works best for emerging creators establishing initial pricing.
Rarity scoring uses mathematical models to assess trait combinations. A 1-of-1 background in Bored Ape #8817 contributed to its $3.4 million sale. Platforms apply algorithms weighing 12+ attributes to calculate scarcity multipliers.
Leveraging Data Analytics for NFT Forecasting
Modern collectors and investors navigate digital markets through data-driven insights. Analyzing patterns in sales activity and blockchain records helps identify emerging opportunities. Platforms now process billions of transactions to uncover hidden correlations between asset traits and market behavior.

Utilizing Historical Sales Data Effectively
Cleaning datasets removes outliers that skew predictions. Analysts filter incomplete records and adjust for marketplace fees to create accurate baselines. For example, Q3 2023 saw 18% of listings with mismatched metadata requiring correction.
Seasonal trends impact values significantly. Holiday periods often boost art collections by 33%, while gaming assets peak during product launches. Cross-referencing timestamps with cultural events improves forecast accuracy.
Integrating On-Chain Transaction Analysis
Blockchain explorers reveal critical details about buyer behavior. Gas fee spikes indicate high-demand periods, while wallet clustering exposes coordinated trading activity. Tools like Etherscan track these patterns across 12+ networks.
Automated dashboards combine multiple metrics for real-time insights. Successful systems monitor:
- Wallet age and transaction frequency
- Smart contract interactions
- Token movement between exchanges
Merging these datasets with social media sentiment creates a 360-degree market view. However, analysts must distinguish between organic trends and artificial hype generated by influencer campaigns.
Implementing Machine Learning and Predictive Models
Artificial intelligence transforms how analysts decode complex market patterns. Advanced systems process millions of data points from blockchain records and social platforms. This enables real-time identification of emerging trends invisible to manual review.

Supervised Learning and Neural Networks
Regression models excel at spotting relationships between historical sales and asset features. A decision tree might reveal that blue-chip collections gain value when trading volume spikes 40% above average. Over 72% of blockchain firms now use these techniques to refine strategies.
Neural networks detect subtle behavioral patterns across decentralized platforms. These systems analyze:
- Wallet interaction frequencies
- Trait preference shifts over time
- Cross-platform arbitrage opportunities
Evaluating Model Performance and Feedback Loops
Top-performing systems achieve 85% accuracy through continuous improvement cycles. Precision metrics track how often predictions match actual sales within 15% ranges. Recall rates measure successful identification of undervalued assets.
Effective models adapt to sudden market changes through:
- Weekly retraining with fresh transaction data
- Social sentiment integration from 12+ sources
- Automatic weighting adjustments for key features
Successful implementations boost profit margins by 20% through optimized buying windows. However, analysts must validate outputs against live market conditions – even advanced algorithms struggle with unprecedented events.
Navigating Market Trends and Regulatory Considerations
Investors face a dual challenge in digital collectibles: volatile trends and evolving rules. Shifting global economics and tech advancements reshape opportunities weekly. Staying ahead demands agile data interpretation and risk awareness.
Assessing Macroscopic Market Trends
Broader economic forces impact blockchain assets disproportionately. Interest rate changes can alter investor behavior within 48 hours. Real-time analytics now track 14 macroeconomic indicators, from energy prices to tech stock performance.
Social sentiment remains critical. Viral content creators can sway values faster than traditional markets. Platforms monitoring 50+ social channels help spot emerging patterns before they dominate headlines.
Understanding Blockchain Risks and Regulatory Shifts
Cryptocurrency regulations evolve rapidly across jurisdictions. Recent U.S. proposals aim to classify certain tokens as securities. Such changes require proactive management strategies to avoid compliance pitfalls.
Decentralized systems introduce unique vulnerabilities. Smart contract exploits caused $680 million losses in 2023 alone. Savvy stakeholders now audit code and monitor wallet activity across multiple chains simultaneously.
Successful navigation hinges on blending market awareness with legal foresight. Those who master both realms position themselves to thrive amid uncertainty.


No comments yet