Understanding how digital asset values move is key for anyone involved in the financial markets. Two of the most powerful ideas in this space are support and resistance. These concepts help traders see where an asset’s price might stop or change direction.
This knowledge is a cornerstone of technical analysis. It gives you a framework to make smarter choices. You can better time your entries, manage risk, and spot potential breakout moments.
This guide will walk you through everything. We start with basic definitions and move to practical strategies. You will learn how to identify these critical zones on a chart for assets like Bitcoin.
Mastering these essential tools can significantly improve your trading outcomes. Both new and seasoned investors rely on them to navigate the unique 24/7 volatility of the crypto market.
Introduction to Support and Resistance in Crypto Trading
Price movements in financial markets reveal hidden boundaries where supply and demand reach equilibrium. These invisible lines form through collective trader activity. They represent critical decision points for market participants.
Market Dynamics and Key Trading Concepts
Market forces create predictable patterns through buyer and seller interactions. When prices decline, increased buying interest often emerges. This creates zones where downward momentum typically pauses.
Conversely, rising prices attract selling pressure at certain levels. These areas become natural barriers to further upward movement. The table below illustrates these fundamental market forces:
| Market Force | Price Action | Trader Behavior | Resulting Zone |
|---|---|---|---|
| Buying Pressure | Price Decline | Increased Demand | Potential Reversal Area |
| Selling Pressure | Price Increase | Profit Taking | Potential Pause Point |
| Equilibrium | Sideways Movement | Balanced Activity | Consolidation Phase |
The Role of Technical Analysis in Crypto
Technical analysis provides the framework for identifying these critical market areas. It focuses on historical price data and trading volume. This approach helps forecast potential future movements.
The methodology works across various timeframes and asset classes. It’s particularly valuable in markets where traditional analysis has limitations. Many successful traders combine these tools with other indicators.
The Core Concepts of Support and Resistance
At the heart of chart analysis lie two fundamental pillars that define market structure. These ideas are essential for interpreting price action and making informed decisions.
Defining Support and Resistance
A support level acts like a floor for an asset’s value. It is a price point where buying interest becomes strong enough to halt a decline. Traders often see these areas as potential opportunities to enter a position.

Conversely, a resistance level functions as a ceiling. This is where selling pressure intensifies, preventing the price from rising further. It represents a zone where supply overwhelms demand.
It’s crucial to understand that these are often zones, not single lines. A support zone forms when the price finds a floor multiple times near the same area. The same logic applies to resistance.
These concepts emerge from market psychology. Traders remember where significant buying or selling occurred previously. This collective memory makes these areas self-fulfilling.
Grasping the supply and demand dynamics behind these zones is key. It allows you to predict how prices might behave when they approach these critical thresholds on a chart.
Historical Examples and Case Studies
To truly grasp the power of these trading concepts, we must examine how they have played out in real market conditions. Historical data provides clear evidence of where market forces have previously clashed.
These past events create a roadmap for future price action. They show us where to expect potential turning points.
Bitcoin’s Price Behavior at Critical Levels
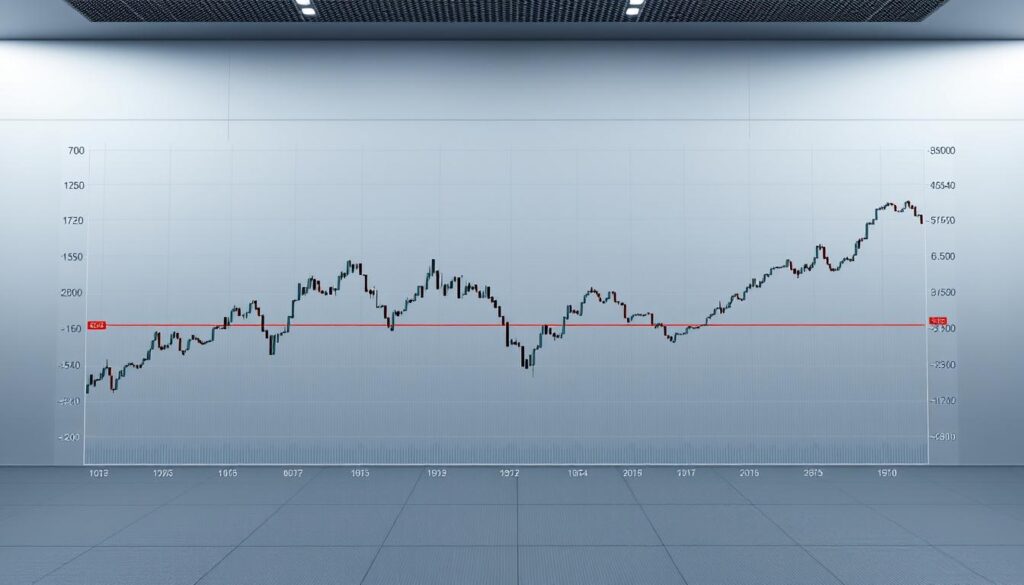
Consider a period where Bitcoin’s value was rising. It approached the $108,000 mark but could not break through. This area became a significant barrier.
Selling pressure intensified, causing the price to reverse. The $100,000 point also acted as a ceiling, halting upward momentum.

On the decline, the asset found a floor near $90,000. Buying interest was strong enough to prevent a further drop. This created a well-defined support zone.
The market then traded sideways between $90,000 and $108,000. This channel represented a consolidation phase. The 200-day Simple Moving Average near $78,500 offered another potential floor.
This pattern is not unique to Bitcoin. Solana faced rejection multiple times at $205. Hyperliquid encountered a similar barrier at $50.
These are clear resistance zones. Sellers consistently overwhelmed buyers at these specific valuation points.
| Cryptocurrency | Resistance Zone | Support Zone | Market Phase |
|---|---|---|---|
| Bitcoin (BTC) | $108,000 / $100,000 | $90,000 / $75,000 | Consolidation |
| Solana (SOL) | $205 | N/A in this example | Rejection |
| Hyperliquid (HYPE) | $50 | N/A in this example | Rejection |
Analyzing these events helps traders anticipate future behavior. When price returns to these historical areas, increased activity is likely.
Support and Resistance Crypto Levels
The most reliable trading zones emerge from areas where market psychology creates memorable price points. These critical thresholds form where buying and selling pressure previously reached equilibrium.
Utilizing Price History to Identify Key Levels
Previous price swings offer the clearest roadmap for finding significant market boundaries. Look for areas where asset values consistently changed direction.
Floor zones typically develop around historical lows where downward momentum halted. Ceiling areas form near peaks where upward movement paused.

Establishing Reliable Support and Resistance Zones
Market confirmation occurs when price tests a specific valuation multiple times without breaking through. The three-touch rule indicates a zone’s significance.
Each successful test strengthens the barrier’s psychological importance. More touches increase reliability for future trading decisions.
| Number of Touches | Zone Significance | Trader Confidence | Typical Market Reaction |
|---|---|---|---|
| 1-2 | Potential Zone | Low | Minor Pause |
| 3-5 | Confirmed Area | Medium | Noticeable Reversal |
| 6+ | Strong Barrier | High | Significant Movement |
Major thresholds can withstand up to ten tests while maintaining their integrity. These well-established areas offer the highest probability trading opportunities when scanned correctly on charts.
Identification Techniques in Crypto Trading
Professional traders employ diverse identification methods to pinpoint significant price zones with greater accuracy. These approaches work together to create a comprehensive system for market analysis.

Chart Patterns, Moving Averages, and Trendlines
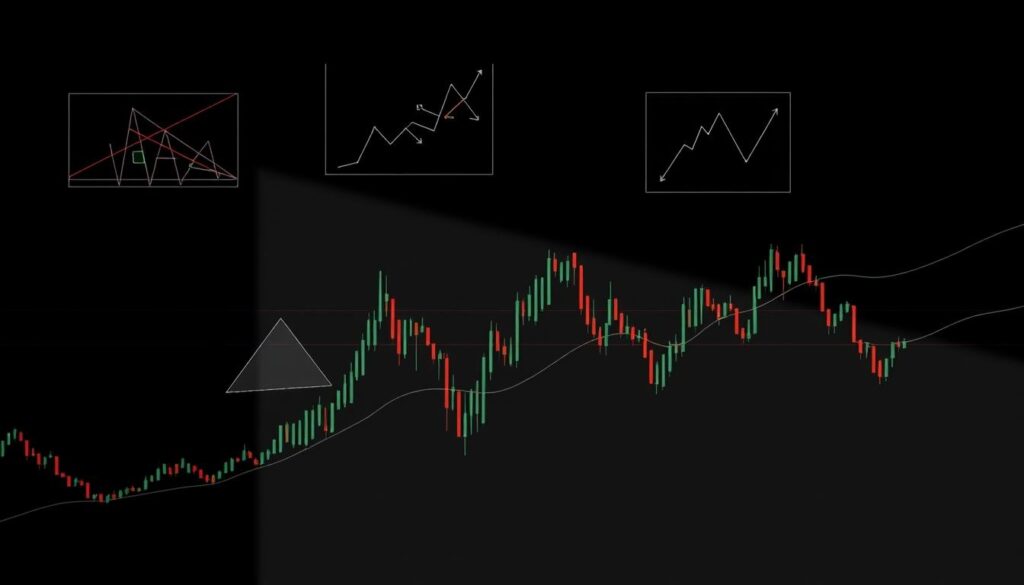
Common formations like double tops and head-and-shoulders create natural boundaries. These patterns establish clear zones where prices tend to reverse direction.
A moving average serves as a dynamic tool that adapts to current market conditions. This indicator smooths price data, revealing important thresholds that change over time.
During uptrends, the moving average often acts as a floor for asset values. In downward trends, it frequently becomes a ceiling that prices struggle to breach.
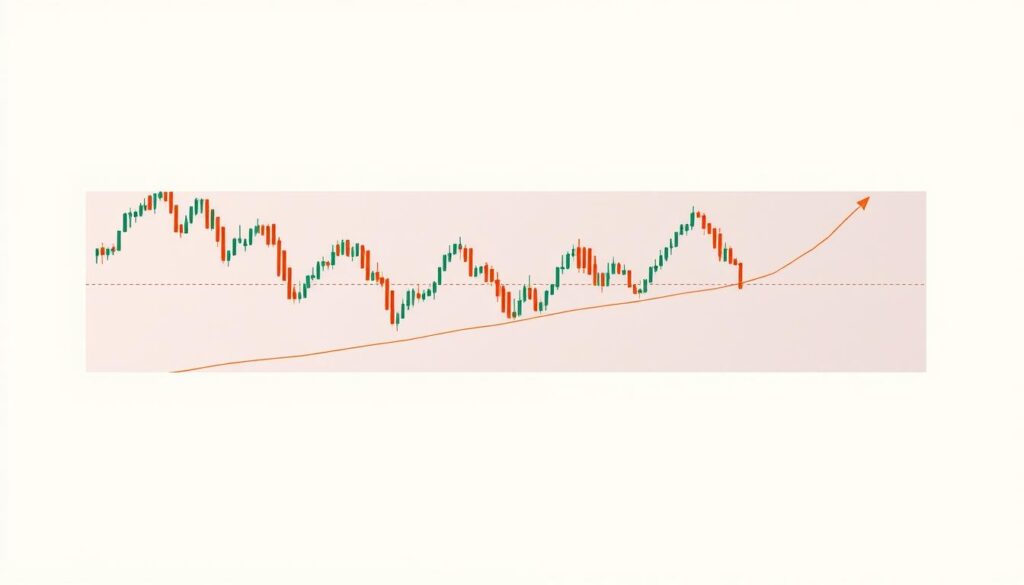
Trendlines connect significant price points to define market direction. These diagonal lines provide early signals before prices reach horizontal zones.
| Technique | Primary Use | Timeframe | Strength |
|---|---|---|---|
| Chart Patterns | Zone Identification | Medium to Long | High Reliability |
| Moving Averages | Dynamic Levels | All Timeframes | Adaptive Nature |
| Trendlines | Trend Definition | Short to Medium | Early Signals |
Switching from candlestick to line charts can filter market noise. This reveals cleaner price action and clearer threshold areas.
Combining these methods creates confluence zones where multiple techniques align. These areas offer the highest probability trading opportunities.
Drawing Effective Support and Resistance Lines
Mastering the art of drawing these critical markers transforms theoretical knowledge into practical trading skill. Proper technique creates clear visual boundaries that guide decision-making.
Step-by-Step Line Drawing Instructions
Begin by identifying significant peaks and troughs on your chart. Draw horizontal lines through these key points using closing prices for accuracy.
Extend these markers backward to validate their historical significance. Multiple touches at the same price area strengthen its importance for future trades.
Using Price Zones for More Accurate Levels
Instead of single lines, focus on ranges where value tends to stall. This approach accommodates market volatility more effectively.
Create zones around your identified areas to capture natural price fluctuations. This method provides a realistic view of where buying or selling pressure typically emerges.
Keep your drawings clean and horizontal for clarity. Space them evenly to avoid chart clutter while maintaining visual usefulness for identifying potential breakouts.
Psychological Factors Influencing Market Levels
The collective mindset of market participants establishes natural barriers that influence trading outcomes. These invisible thresholds emerge from shared emotional experiences rather than pure technical analysis.
Trader Psychology and the Impact of Round Numbers
Market behavior often reflects common emotional patterns. Traders who bought at higher valuations hope to break even when prices return to their entry point. This creates selling pressure at those specific valuation points.
Similarly, those who sold too early wait for buying opportunities at their previous exit levels. These collective decisions form predictable zones where activity intensifies.
| Psychological Factor | Trader Behavior | Market Impact | Example Price Points |
|---|---|---|---|
| Break-Even Mentality | Selling at entry price | Creates selling zones | Previous purchase levels |
| Regret Avoidance | Buying back after early sale | Forms buying areas | Historical exit points |
| Round Number Bias | Order clustering | Strong barriers | $100, $1,000, $10,000 |
| Anchoring Effect | Using past levels as reference | Self-fulfilling zones | Memorable historical points |
Round numbers act as particularly strong psychological anchors. The human brain naturally gravitates toward easily remembered figures like $90,000 or $100,000. This explains why whole number valuation points often become significant market turning points.
Understanding these psychological tendencies gives traders an edge. They can anticipate where collective behavior will likely create meaningful price barriers.
Enhancing Trading Strategies with Support and Resistance
Strategic traders elevate their market performance by integrating critical price thresholds into their decision-making process. These zones become powerful tools for timing market entries and exits.
One effective approach involves entering positions near established floors. Traders place protective stops just below these areas to manage potential downside.
Breakout methods offer another proven technique. When price pushes through a ceiling with strong volume, it signals potential continuation. The next higher barrier often becomes the profit target.
Range-bound markets present distinct opportunities. Participants can buy near the bottom of the range and sell approaching the top. This strategy capitalizes on predictable oscillations between boundaries.
Exit planning proves equally important. Taking profits near historical ceilings protects gains during advances. Trailing stops below rising floors lock in profits during sustained uptrends.
| Strategy Type | Entry Signal | Exit Plan | Risk Management |
|---|---|---|---|
| Bounce Play | Price approaches floor | Target ceiling zone | Stop below floor |
| Breakout Trade | Price clears ceiling | Next higher zone | Stop below breakout |
| Range Trading | Bottom of range | Top of range | Stop beyond range |
These methodologies create disciplined frameworks for market participation. They remove emotional uncertainty by relying on objective price action data.
The most successful market participants often build their entire approach around these concepts. This systematic foundation improves timing and risk-reward ratios significantly.
Advanced Tools and Platforms for Analysis
Automated platforms now offer traders powerful capabilities to identify profitable opportunities with precision and speed. These sophisticated tools scan hundreds of assets simultaneously, saving valuable time while improving accuracy.
Leveraging Automated Screeners and Trade Setups
The altFINS platform exemplifies modern analysis technology. It automatically identifies significant price zones when three or more touches occur at specific valuation points. This removes subjective interpretation from the process.
Traders can access pre-identified zones through the Technical Analysis tab. The chart Patterns section helps filter assets approaching or breaking through key thresholds. This focuses attention on high-probability setups.
Regularly updated trade setups for 50 major assets combine multiple indicators. The system incorporates elements like the moving average to predict short-term momentum. This comprehensive approach provides actionable insights.
Automated screening eliminates common manual errors. It prevents drawing excessive lines or missing important areas. Consistent criteria apply across all assets and timeframes.
While these tools provide valuable assistance, understanding core principles remains essential. Traders should validate automated findings with personal analysis. This creates a comprehensive workflow for successful market participation.
Mistakes to Avoid in Trading Support and Resistance
Even experienced traders can undermine their own success by making common analytical errors. Recognizing these pitfalls helps maintain clarity in your market approach.
Overcrowding Charts and Misinterpreting Signals
One frequent error involves marking too many price thresholds on your chart. This creates visual clutter that obscures truly significant areas. Focus instead on the most obvious and frequently tested zones.
Another mistake is rigid interpretation of exact price points. Markets often treat these areas as zones rather than precise numbers. Prices may briefly dip below a floor or reverse before reaching a ceiling.
Many participants ignore candlestick wicks or give them excessive weight. The proper approach depends on context—whether these represent genuine tests or temporary liquidity grabs.
Regular updates are essential for maintaining accuracy. Market conditions change frequently, making yesterday’s analysis potentially irrelevant today. Reassess your thresholds after major moves or high-volume sessions.
Remember that no price barrier is unbreakable. These concepts represent probability zones rather than guarantees. Always have contingency plans for when thresholds fail to hold.
Conclusion
Mastering market dynamics requires understanding key price thresholds that guide trading decisions. These concepts form the foundation of effective technical analysis.
Price zones represent psychological battlegrounds where supply and demand interact. This creates predictable patterns that traders can leverage for better outcomes.
Proper identification of these areas helps with entry and exit planning. It also improves risk management during volatile market movements.
Consistent practice with different timeframes develops intuition for significant price points. Integrating this knowledge creates a structured approach to market participation.
Remember that these tools work best when combined with other indicators. They provide a framework rather than absolute predictions.
Successful traders continually refine their ability to spot meaningful zones. This skill separates consistent performers from occasional participants.


No comments yet